
SAS® Office Analytics
Guided, self-service BI that makes your data work for you.
Why settle for simplistic data analysis in Microsoft Excel? Create analytic content, and share it in a well-governed manner using Microsoft Office applications. Tell stories with your data. And put powerful insights in everyone's reach to spark collaboration and inspire better-informed decisions.
Benefits
Work your SAS® from Microsoft Office.
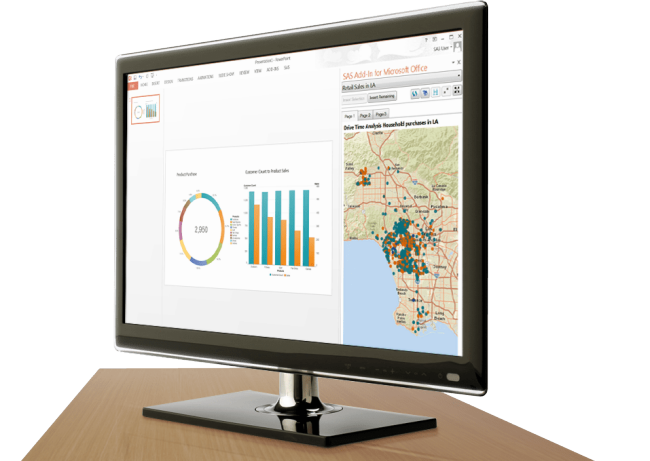
Just point and click through your familiar Microsoft Office interface and application of choice. It's that easy to analyze large amounts of data and view results directly in Microsoft Word, Excel, PowerPoint and Outlook.
Set your IT team free.
Business analysts and novice users can get on board quickly thanks to guided analysis via built-in tasks and visual process flows in SAS® Enterprise Guide®. Users can quickly access, prepare and integrate data to meet evolving business requirements. And IT is free to focus on other priorities.
Create, share and collaborate – with anyone, anywhere.
Create and distribute rich, interactive content delivered through an established framework. Publish charts, graphs and other visuals created in SAS Visual Analytics to Microsoft Office users. Tell stories. Collaborate. And gain new perspectives.
Prioritize and get your jobs done faster.
Integration with SAS Grid Manager means you can easily meet peak workloads, prioritize jobs and ensure that jobs have the best available resources. Grid computing greatly improves productivity and efficiency, and gives you results sooner.
Features
- Data access and centralized metadata management.
- Guided analysis.
- Storytelling and interactive reporting.
- Microsoft Office integration.
- Integrated with SAS Visual Analytics.
- Includes SAS Enterprise Guide.
Technical Information
SAS has not only helped us to understand what we have and where we could go, but it has also made suggestions about how we can integrate new thinking into what we’re doing to drive better value.
Recommended Resources
Learn how easy it is to combine analytic visualizations and reports with Microsoft products to share insights.
View this on-demand webinar to discover how SAS Visual Analytics and Microsoft Office enable powerful collaboration.
Looking for information on how to buy?
Need additional information? Get details on solutions, licensing, deployment and more.
