Same processes, significantly better yield
Murata Manufacturing improves production yield with analytics
How do you increase yield without changing longstanding manufacturing processes? Murata Manufacturing did it by analyzing data across multiple processes and plants. This allowed the company to improve processes without revamping them. Murata annually manages $5 billion of business via SAS® Analytics. If the company improves 1 percent production yield with analytics, it means savings of $50 million in a year.
Our objective is to improve production, not spend time producing or collecting data.

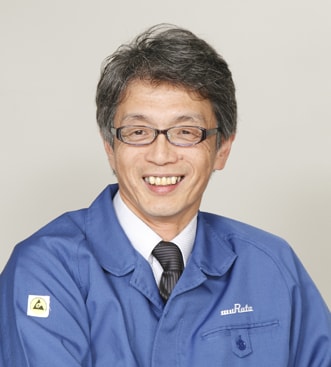
Makoto Miyamori
Senior Manager of the No. 2 Manufacturing Innovation Section
Murata manufactures electronic components such as capacitors, inductors, resistors, filters and sensors that are used in smartphones, audiovisual equipment and vehicles. It specializes in custom-designed parts and has a philosophy to take a scientific approach to the manufacturing process. In the 1990s, Murata was ahead of its competitors in collecting data generated at the point of production, and using it to improve quality control.
“If we spot something in the data, we act upon it to achieve improvement,” says Makoto Miyamori, Senior Manager of the No. 2 Manufacturing Innovation Section in the Manufacturing Enhancement Department.
But the manufacturing process is data intensive. Electronic component manufacturing is a multistep process with a different person responsible for each stage. The company quickly realized that it needed one repository from which data for all stages could be analyzed for quality, cost and delivery issues. It then needed to mine the data effectively, and with a sophisticated level of understanding. The failure of individual components is just one possible factor in quality issues. The temperature that components are subjected to during the manufacturing process can cause issues. The engineers at Murata analyze various kinds of data; not only the external air temperature and the ambient temperature inside the factory, but also the temperature data measured by factory equipment.
“The number of different elements to be covered by data mining grows massively,” says Osamu Shimoyae, Manager of the No. 2 Manufacturing Innovation Section in the Manufacturing Enhancement Department. Another source of difficulties was the time it took to import and cleanse detailed sensor data from equipment and other data. To efficiently gather and mine this big data, Murata chose SAS® Production Quality Analytics.
Comprehensive and detailed analysis
The first win for Murata was in data coordination. Murata now has access to all of the data managed in all of the company’s factories. Engineers can easily retrieve the data they need on their desktops. This reduces time spent finding data and merging data that straddles different processes. Meetings used to be spent discussing how to produce or collect data. Now the engineers focus on analyzing and testing against the data. They can concentrate on analyzing data in ways that integrate insights on operations or production lines, for example, by using data on similar processes at different factories.
“If there are two products with different distributions in their defect rates, even though they use the same manufacturing process, then naturally we will tackle them in different ways,” Miyamori says. “Our objective is to improve production, not spend time producing or collecting data.”
An improvement of just 1 percent means a gain of $50 million
Murata produces thousands of different products just in its capacitor line alone. Its production volume is in the tens of billions per month. For each type of part there are multiple variables that can affect yield. “The things we analyze include air temperature, the water temperature in pipes and particles in the air. So the most important thing in any analysis is having a proper view of the workplace,” Shimoyae says. “When we discuss problems, we invite technical experts to the meeting to get their opinions. After looking at the production line, we use data to find what we could not see with our eyes.”
Judging ROI on analytics isn’t easy, but Miyamori acknowledges that even modest gains lead to substantial benefits. He estimates that just a 1 percent yield gain results in $50 million savings. “That is why we need to look for the detail in such a large amount of considerably varied big data,” Miyamori says.
By deepening its understanding of data mining, the manufacturer has seen impressive results. With Murata’s scientific approach to improvement, SAS will continue to be its weapon for maintaining its world-leading position.

Challenge
- Increase efficiency of data mining to improve yield.
- Create a single view of enterprise quality data.
Solution
SAS® Production Quality Analytics
Benefits
One view of data from across multiple sensors, components and factories helps increase production yield.
