SAS Visual Analytics
Now everyone can easily discover and share powerful insights that inspire action with a single application for reporting, data exploration and analytics.

Key Features
Interactive reporting. Visual discovery. Self-service analytics. Scalability and governance. All from a single, powerful in-memory environment.
Embedded insights
Embed individual visual insights from SAS Visual Analytics reports, build interactive stories or embed the whole interactive report or page into your custom web applications. Publish your insights that scale with the flexibility of live data or embedded data snapshots for data storytelling.
SAS Visual Analytics Apps for mobile devices
Use native mobile apps for iOS and Android to view and interact with others through dynamic reports and dashboards on tablets and smartphones.
Open integration for developers
Add creative visualization with third-party JavaScript libraries, such as D3 and C3, with full interactivity within SAS Visual Analytics. Leverage open source development resources for developers and REST APIs for any client language to access SAS analytics, data and services.
Get to know SAS Visual Analytics
See SAS Visual Analytics in action in interactive demos
Discover how quickly and easily you can explore and understand data to resolve various industry and business issues.
-
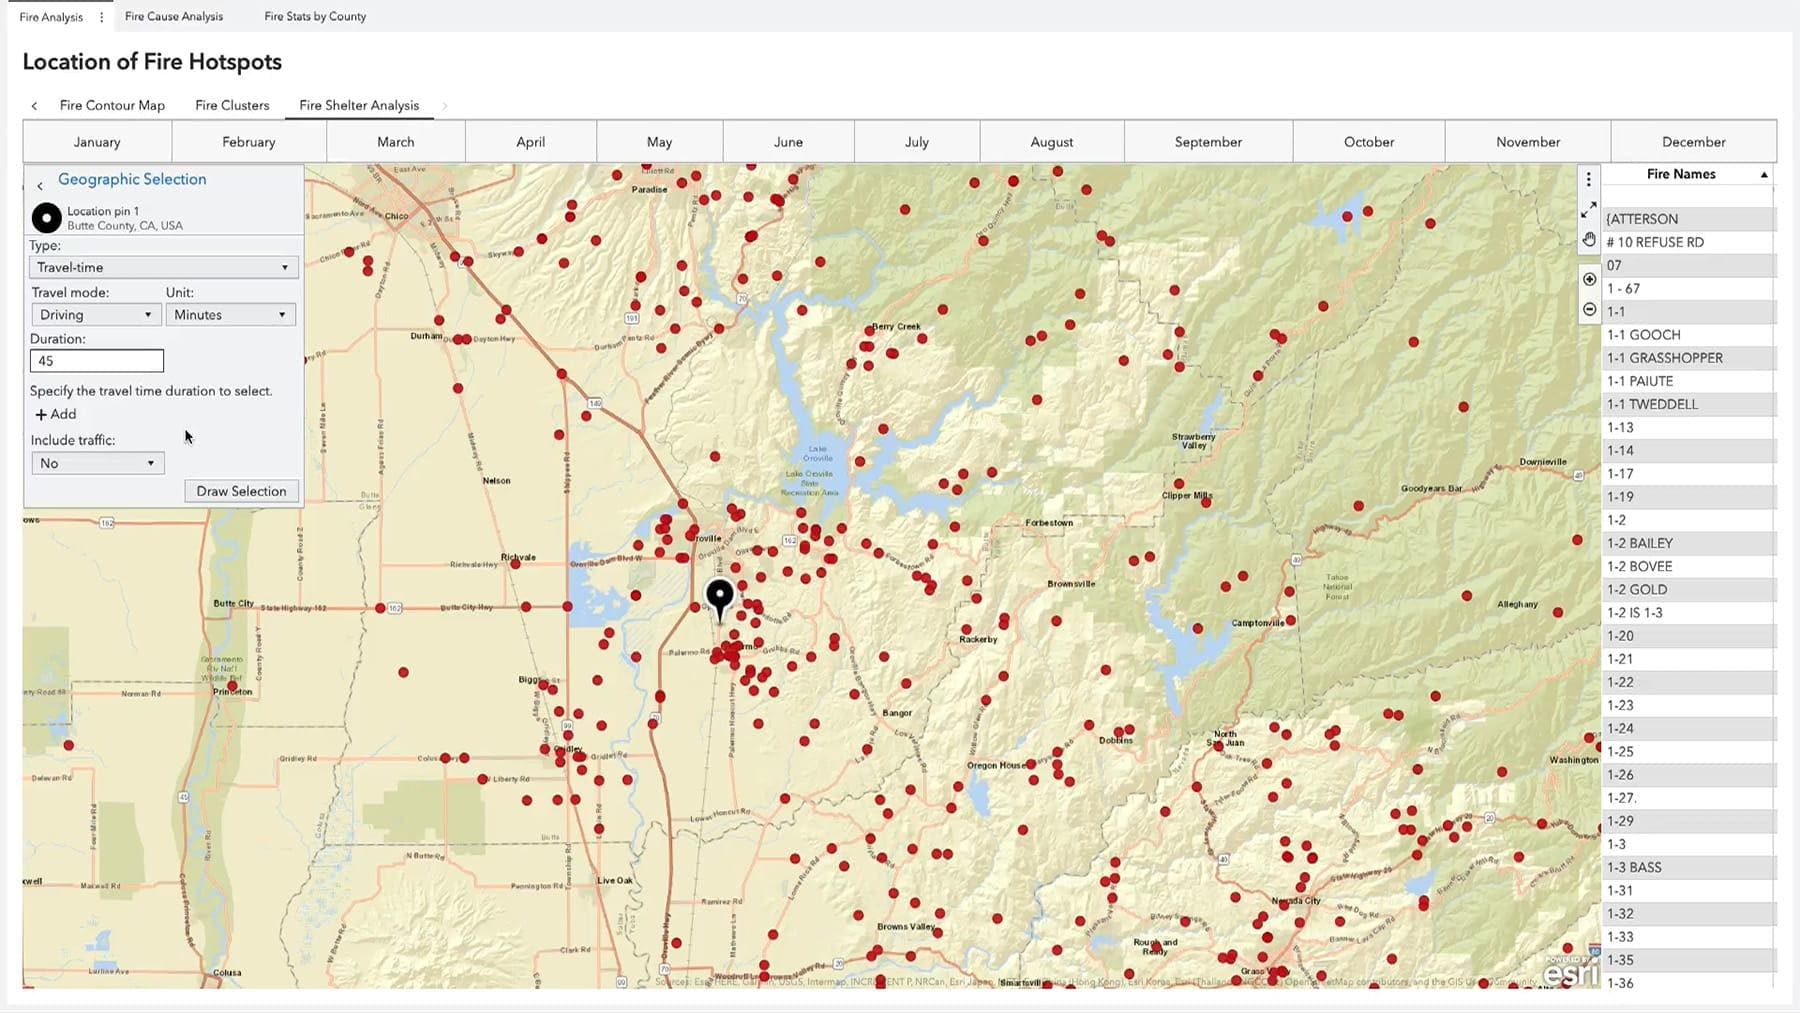
PUBLIC HEALTH Emerging Disease Surveillance & ForecastingCreate an automated, insightful and transparent surveillance program for use in detecting new disease activity and tracking seasonal diseases.
-
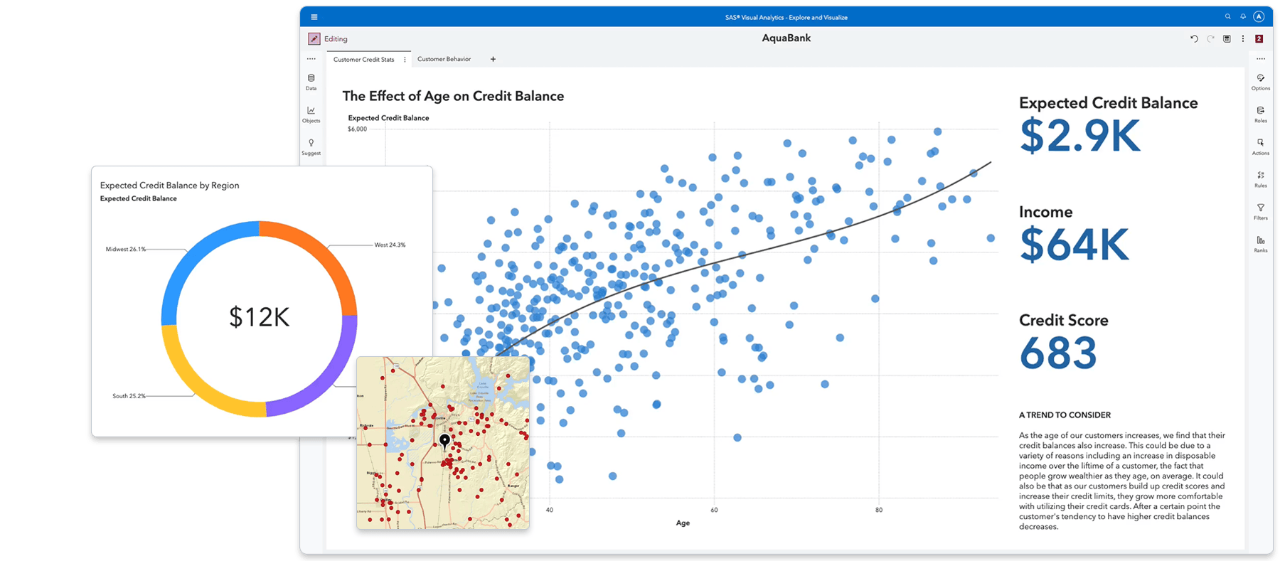
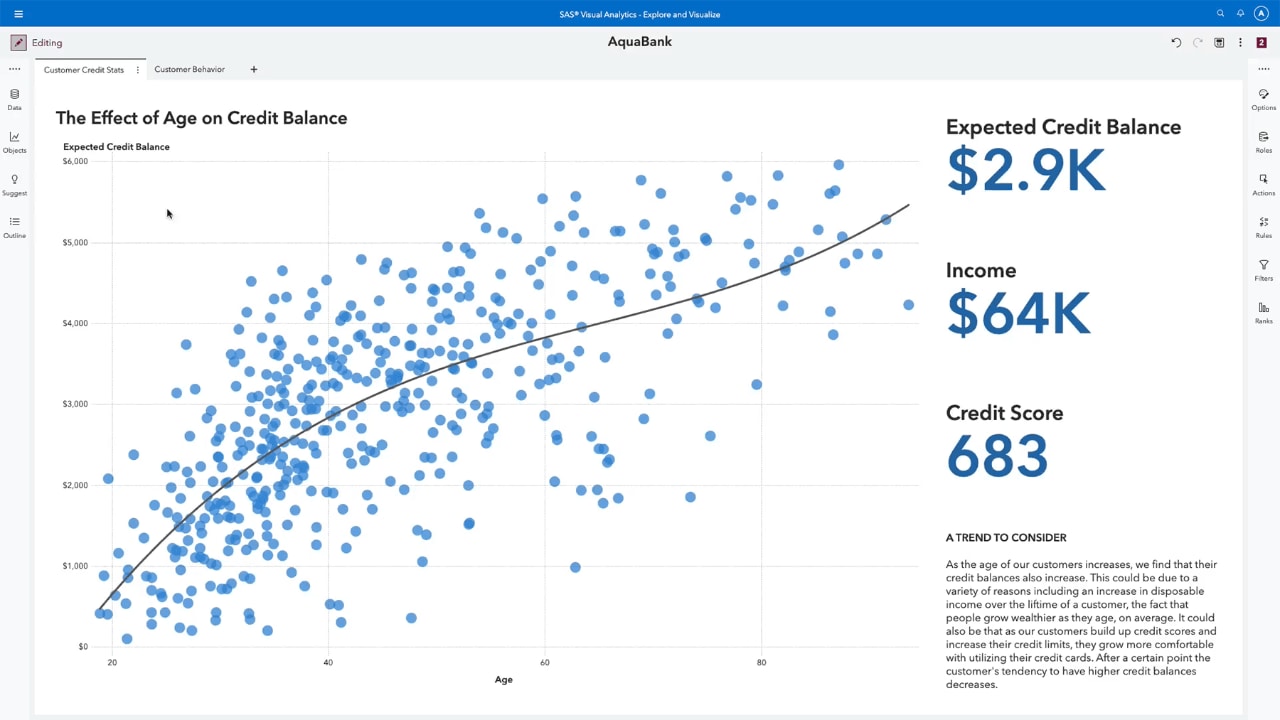
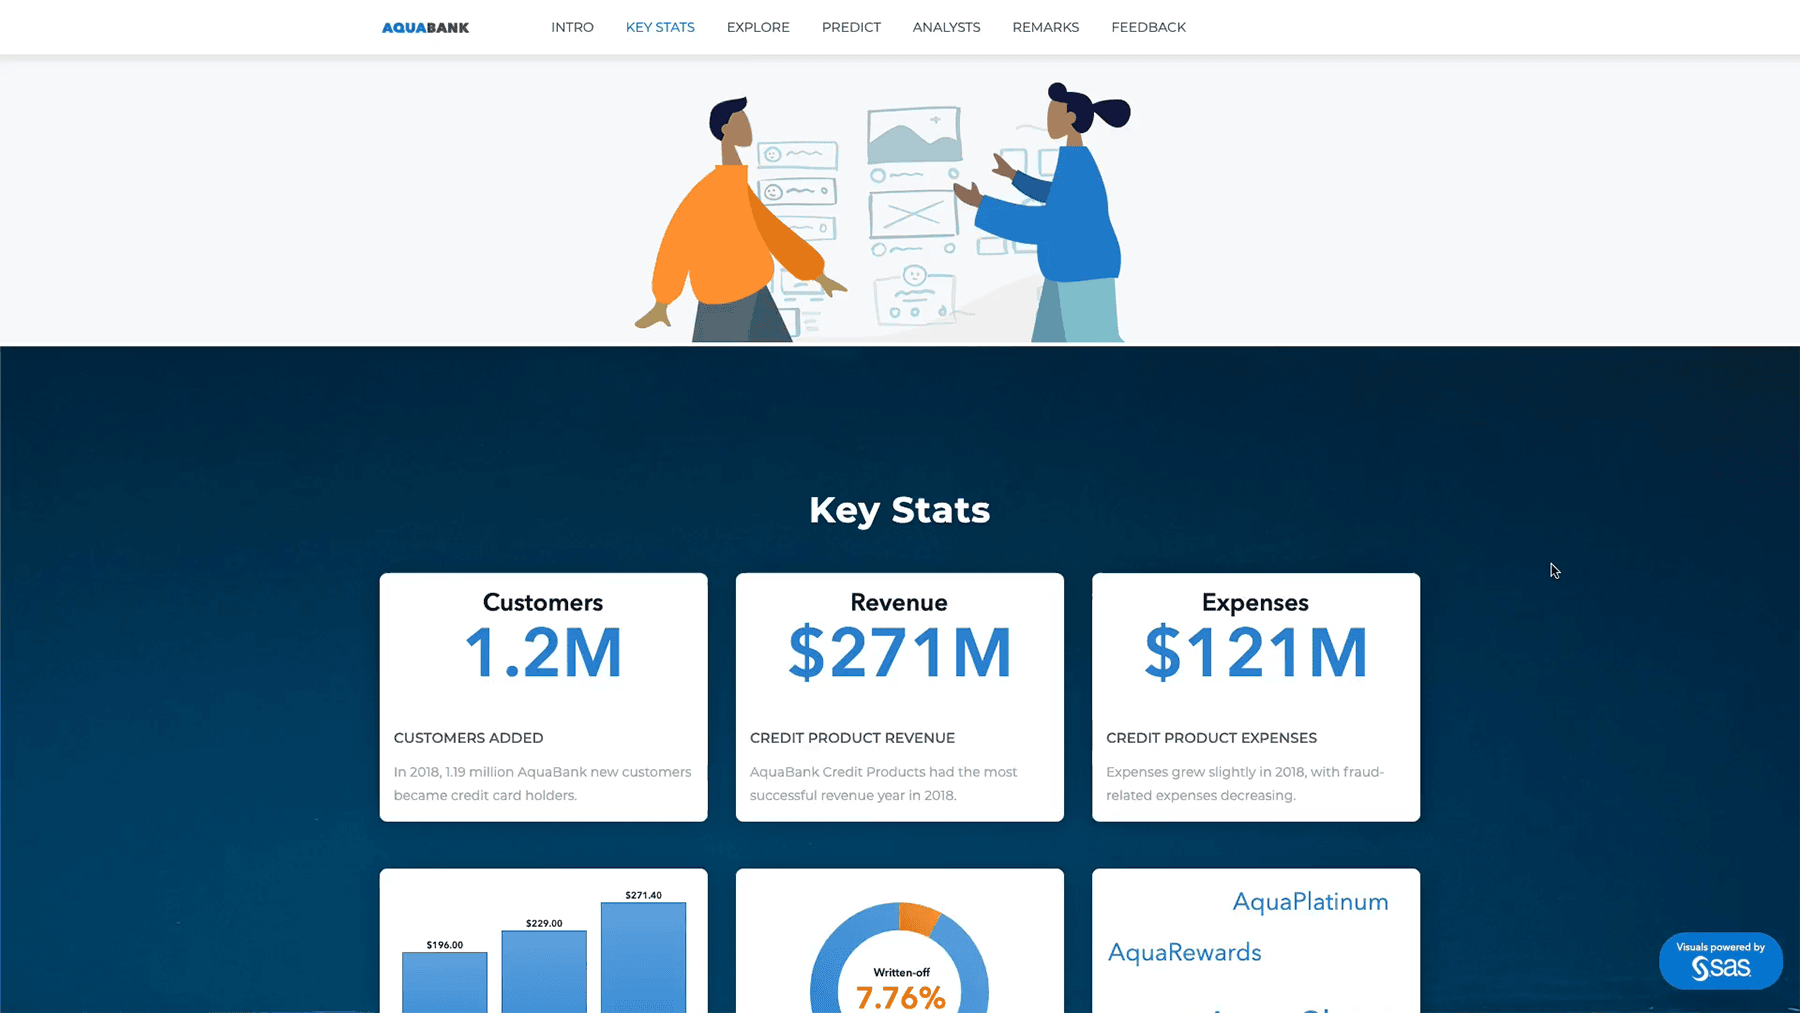
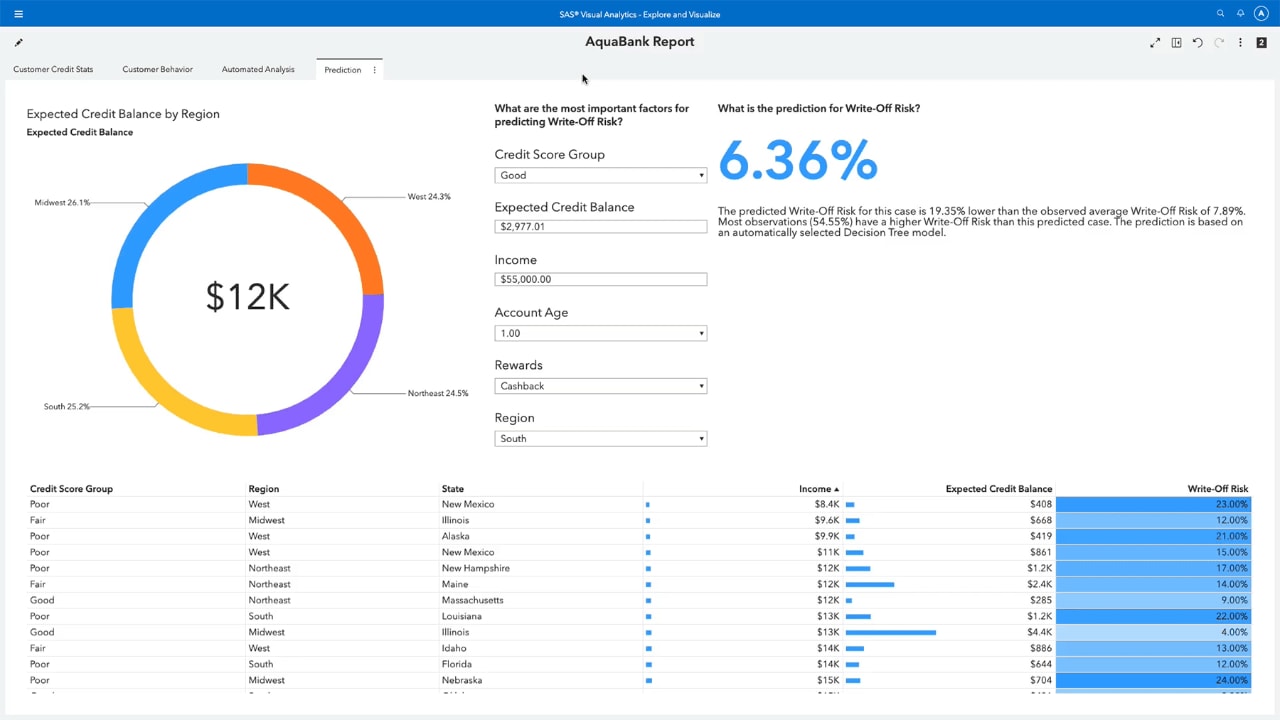
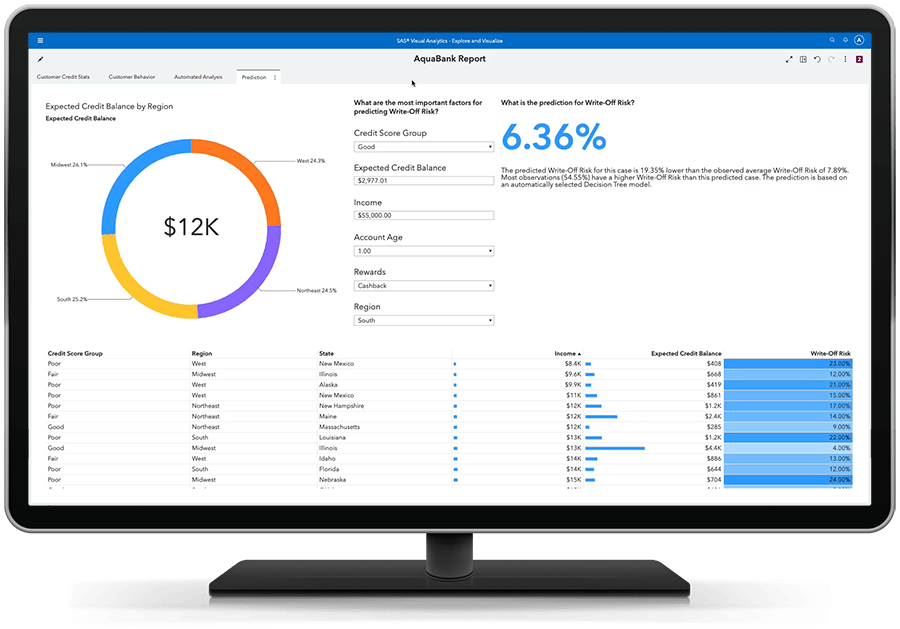
BANKING Banking & Risk InsightsGet a holistic view of risk and performance across regions, down to the individual counterparty level.
-
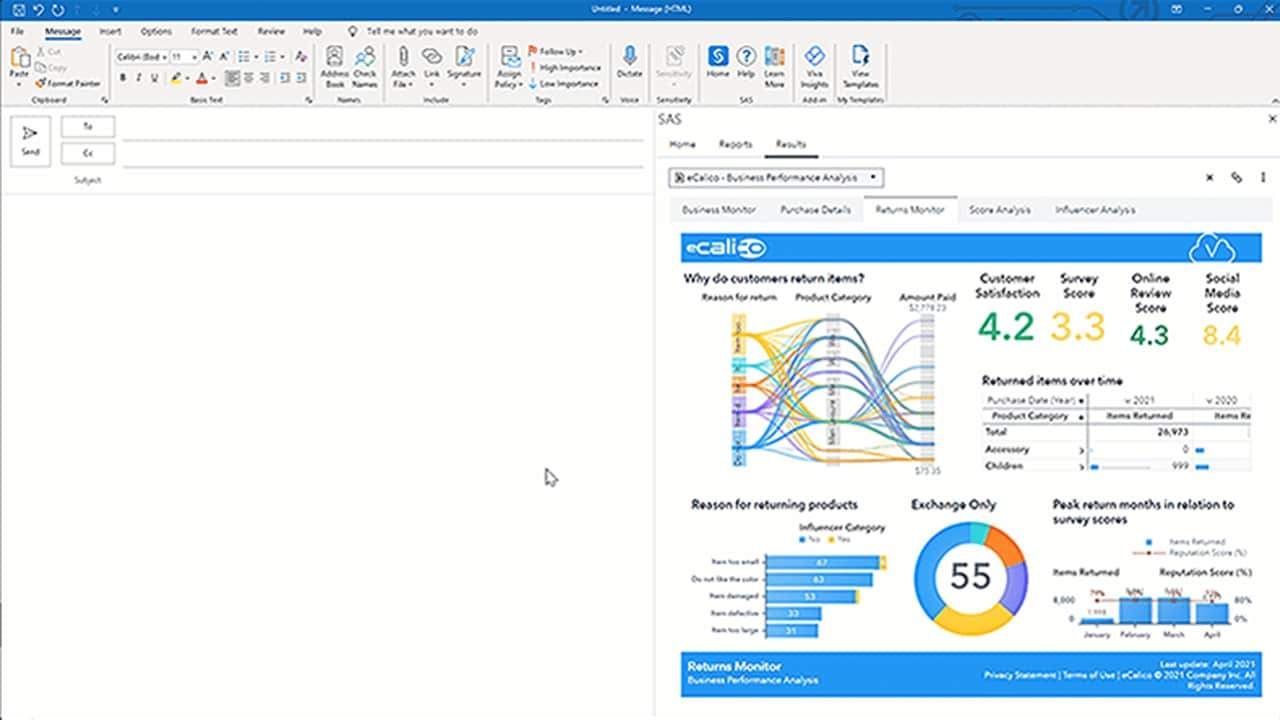
RETAIL & CONSUMER GOODS Retail InsightsAnalyze regional store performance, and make data-driven decisions about retail business functions.
-
MANUFACTURING Warranty AnalysisAnalyze warranty claims to quickly identify potential issues and their underlying causes.
-
UTILITIES Water Consumption & QualityMonitor the quality and consumption of this critical natural resource.

SAS Viya is cloud-native and cloud-agnostic
Consume SAS how you want – SAS managed or self-managed. And where you want.

Recommended resources for SAS Visual Analytics
To browse resources by type, select an option below.
-
- Select resource type
- Artykuł
- E-book
- HISTORIA KLIENTA
- White Paper
- Wywiad
-
HISTORIA KLIENTA Getting more people behind the wheel with predictive modeling and personalized financing solutions
-
HISTORIA KLIENTA Integrating data, generative AI and human expertise to tackle global warming
-
E-book Government navigating an uncertain world
-
HISTORIA KLIENTA Award-winning bank’s data-driven strategy boosts productivity, efficiency and customer centricity

SAS® Visual Analytics
Zobacz, co mówią klienci
Wsparcie procesów decyzyjnych na poziomie operacyjnym, strategicznym, finansowym i handlowym w Grupie Atlas.
