Microsoft Integration
SAS for Microsoft 365
Get seamless access to analytical insights by using Microsoft 365 applications alongside SAS Viya.
Leverage the best of both platforms with end-to-end analytics through seamless access to SAS Viya from Microsoft 365.

Collaborate more effectively.
Expand the reach of analytics to help everyone in your organization work together and achieve better business insights. Use tools such as Outlook and Excel to easily access analytics and interact with colleagues.
Easily integrate with SAS Viya.
Put the power of SAS analytics in the hands of any Microsoft 365 user. Only SAS drives faster adoption by surfacing results and key insights in Microsoft 365 applications.


Enhance your presentations.
Add data-driven decisions to your decks through integration with Microsoft PowerPoint. Access to critical insights powered by SAS enables you to interact with and share analytics broadly.

Key Features
SAS for Microsoft 365 is included with SAS Visual Analytics on SAS Viya.
Interact with & embed reports
Browse reports from SAS Visual Analytics, interact with them and insert your report content directly into Microsoft Excel to deliver information to any Microsoft user.
Work with the latest data for up-to-date insights
View and interact with live data in your SAS Visual Analytics reports and seamlessly refresh the visual insights embedded in your Excel application with the latest data.
Insert and access data from SAS Viya in Excel
Interact with SAS data – including searching for what you need – and embed that data in Excel using all your favorite Excel functions.
Interact with reports in Outlook
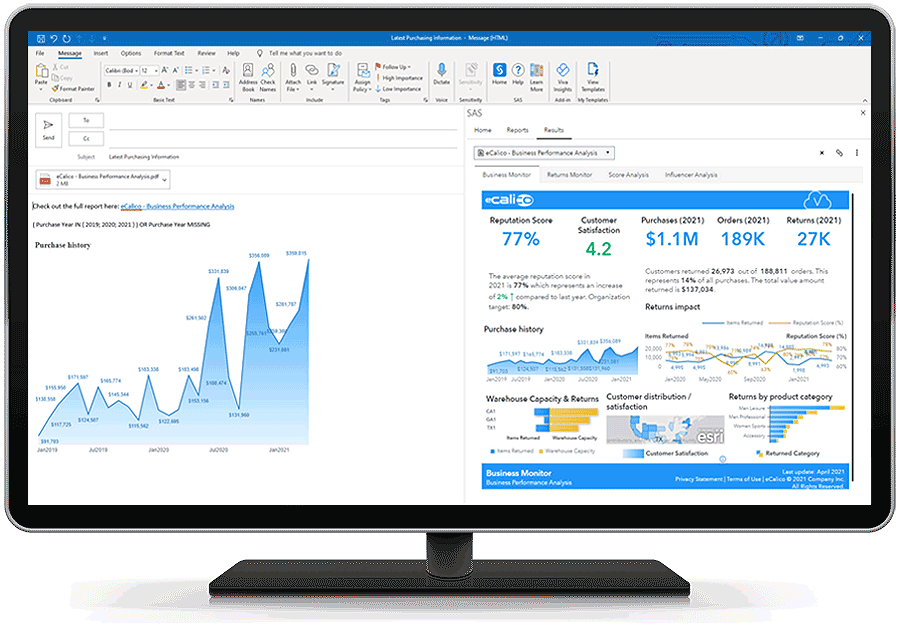
Access SAS Visual Analytics reports in email and even pin contextual reports to enable others to make insights-driven decisions.
Insert report objects and share insights in email
Quickly share analytics insights from SAS in Outlook – just don’t let your inbox get too crowded once you see how easy it is to share analytics via email.
Access in multiple languages
Languages supported include Japanese, Korean, Simplified Chinese, Traditional Chinese, Thai, German, Spanish, French, Italian, Polish, Russian, Arabic, Czech, Danish, English, Greek, Croatian, Hungarian, Hebrew, Norwegian Bokmal, Dutch, Norwegian, Brazilian Portuguese, Portuguese, Slovak, Slovene, Serbian, Swedish and Turkish.
Benefit from the power of SAS Viya
SAS Viya has a redesigned architecture that is compact, cloud native and fast. Whether you prefer to use the SAS Cloud or a public or private cloud provider, you can maximize your cloud investment.
Anticipate more applications
We started with Excel and Outlook because it’s where you work most, but we plan to include additional support for other Microsoft 365 applications.
Insert and share insights in PowerPoint
Use visual insights directly from SAS and share them via PowerPoint to get critical information to audiences of any size.
Related Offerings
Check out these products and solutions related to SAS for Microsoft 365.


