
Visualisation et reporting
SAS Visual Analytics
Désormais, tout le monde peut facilement découvrir et partager des informations pertinentes qui encouragent la prise de décision.
Une application unique pour le reporting, l’exploration et l’analyse des données.
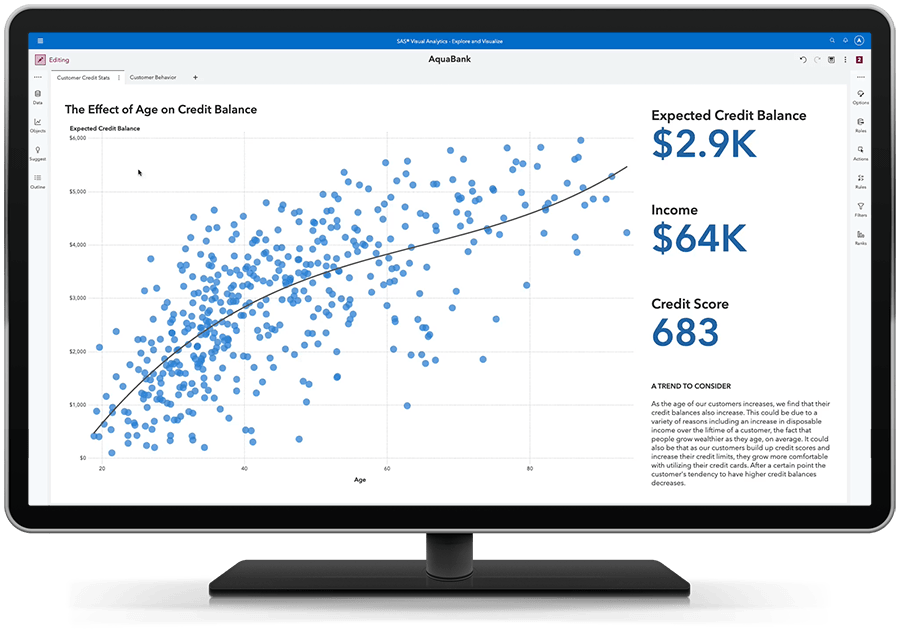
Ayez une vision d'ensemble – et des liens sous-jacents.
Identifiez rapidement les relations importantes dans vos données à l'aide de suggestions et de mesures connexes clairement identifiées. Utiliser l'apprentissage automatique et les explications en langage naturel pour trouver, visualiser et raconter des histoires, présenter des idées faciles à comprendre et à expliquer. Découvrez pourquoi un événement s'est produit, examinez toutes les options et découvrez les opportunités cachées dans vos données. Mettez automatiquement en évidence les relations clés, les valeurs aberrantes, les clusters et bien d'autres éléments pour révéler des informations vitales qui incitent à l'action.
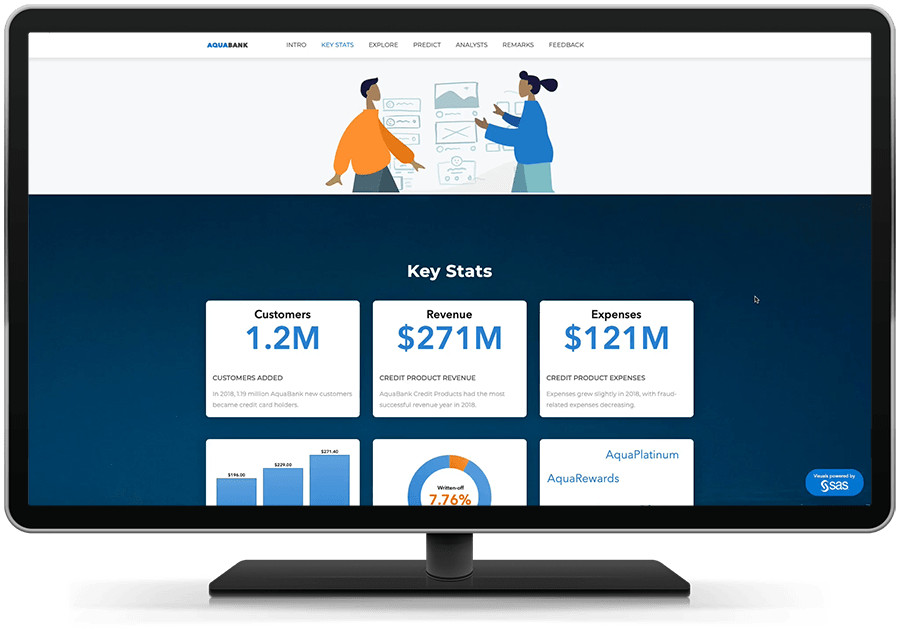
Transformez la vision en compréhension avec des visuels dynamiques.
Créez des rapports et des tableaux de bord interactifs époustouflants. Synthétisez rapidement les principales mesures de performance et partagez-les via le web et les appareils mobiles. Les dirigeants et les collaborateurs peuvent rapidement interagir et collaborer sur les informations, les découper pour trouver leurs propres réponses et mieux comprendre les performances de l'entreprise.
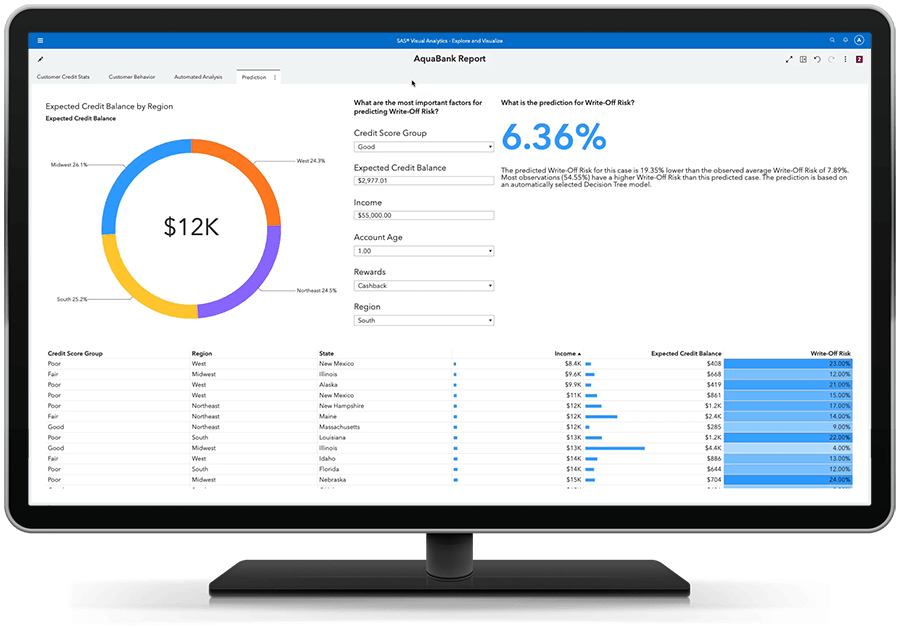
Obtenez des réponses étayées par les données, des résultats basés sur des informations.
Grâce aux analyses prédictives conviviales, les analystes métier peuvent évaluer les conséquences possibles et prendre des décisions éclairées, fondées sur les données, sans aucune programmation. Des algorithmes intelligents permettent de se passer d'une expérimentation manuelle. Et vous pouvez collaborer avec des experts pour extraire les informations les plus pertinentes.
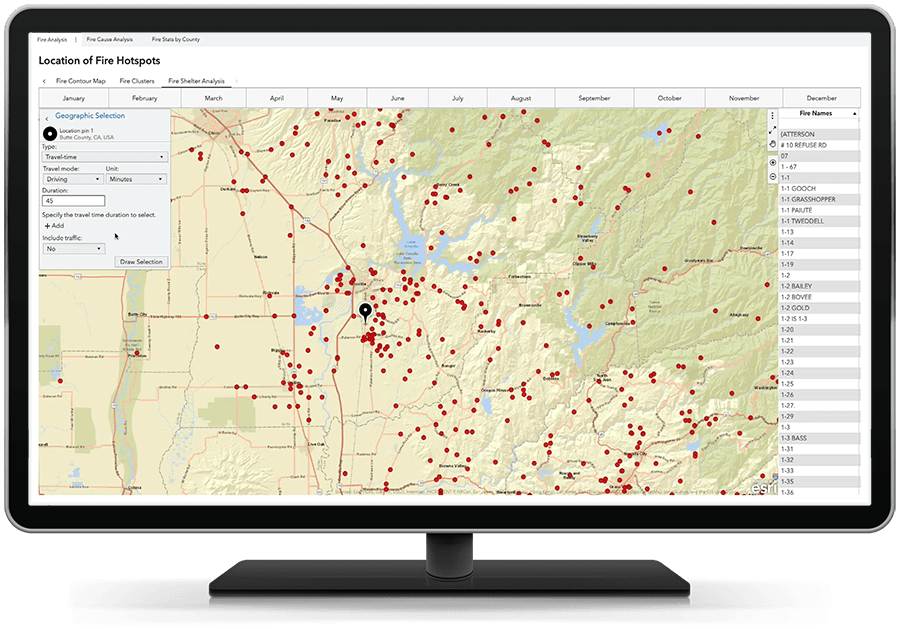
Une dimension géographique supplémentaire.
Ajoutez un contexte géographique à vos analyses et visualisations en combinant des données traditionnelles avec des données de localisation. L'analyse géographique met en avant la dimension "où" afin que vous puissiez analyser les données d'une nouvelle manière pour obtenir une vue d'ensemble avant de prendre des décisions tout en identifiant les opportunités spécifiques à un lieu.
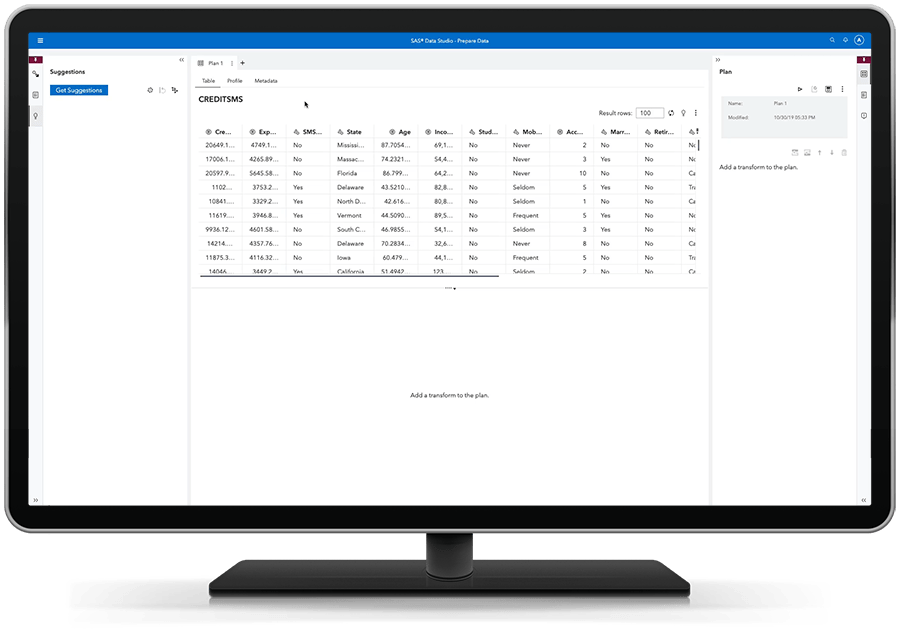
Simplifiez le processus de découverte.
La préparation des données en libre-service permet aux utilisateurs d'importer leurs propres données, de joindre des tables, d'appliquer des fonctions de qualité des données, de créer des colonnes calculées et bien d'autres choses encore, le tout par simple glisser-déposer. En permettant aux utilisateurs d’accéder, de combiner, de nettoyer et de préparer leurs propres données de manière agile et fiable, SAS Visual Analytics facilite une adoption plus rapide et plus large de l’analytique pour l’ensemble de votre organisation.
Obtenez des informations sur le chat.
Une interface visuelle intuitive et low-code vous permet de créer et de déployer des chatbots personnalisés en langage naturel. Obtenez des réponses textuelles, accédez à des données, des rapports et des visualisations, et appliquez même des analyses et de l’IA via une interface conversationnelle en langage naturel. Configurez des bots dans l’environnement SAS pour faciliter l’accès aux informations, ou connectez-vous à des services externes pour les déployer dans le monde entier. Désormais, obtenir des informations à partir de données est aussi simple que d’envoyer un message.
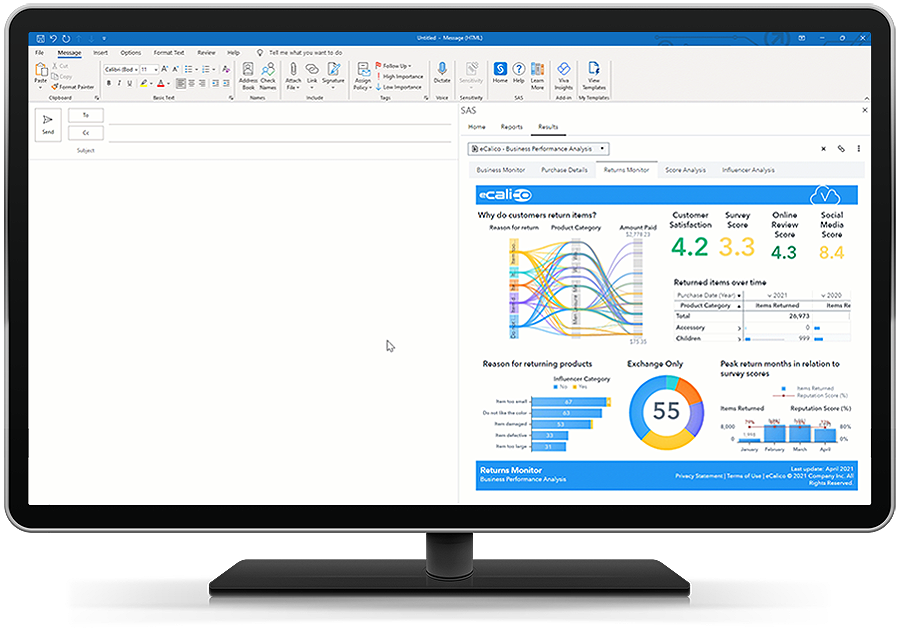
Tirez parti du meilleur des deux plateformes.
Utilisez les outils de productivité Microsoft de Microsoft 365 pour un accès transparent aux analyses de SAS. Explorez vos données, accédez aux rapports de SAS Visual Analytics, interagissez avec ceux-ci, et intégrez des informations dans vos applications Microsoft telles qu’Excel et Outlook. Ensuite, partagez-les avec vos collaborateurs les plus proches.
TÉMOIGNAGES CLIENTS
Découvrez qui travaille plus efficacement avec SAS

Principales caractéristiques
Rapports interactifs. Exploration visuelle. Analyses en libre-service. Évolutivité et gouvernance. Le tout depuis un environnement in-memory unique et puissant.
Accès aux données, préparation & qualité
Accédez aux données, établissez leur profil, nettoyez-les et transformez-les à l'aide d'une interface intuitive qui offre des capacités de préparation des données en libre-service avec une IA intégrée.
Création d'un chatbot personnalisé
Créez et déployez des chatbots personnalisés en langage naturel (NLP) à l'aide d'une interface visuelle intuitive "low-code" pour obtenir des informations et des expériences utilisateur conversationnelles grâce aux chatbots.
Visualisation des données
Explorez visuellement les données, créez puis partagez des visualisations intelligentes et des rapports interactifs via une interface unique en libre-service. L'analyse augmentée et les capacités avancées accélèrent la compréhension en vous aidant à découvrir des informations cachées dans vos données.
Tableaux de bord interactifs, rapports, BI et analyses
Passez directement du reporting et de l'exploration à l'analyse et au partage d'informations via différents canaux, y compris les applications Microsoft Office, à l'aide d'une interface unique.
Analytique en libre-service
Les prévisions automatisées, la recherche d’objectifs, l’analyse de scénarios, les arbres de décision et plus encore sont à portée de main, quel que soit votre niveau de compétence.
Analyse textuelle
Obtenez des informations sur les médias sociaux et d'autres données textuelles et évaluez si le sentiment est positif ou négatif.
Analyse de localisation
Combinez les sources de données traditionnelles (transactionnelles, clients, opérationnelles, etc.) avec les données de localisation pour l’analyse dans un contexte géographique.
L'analytique augmentée
Découvrez les véritables informations cachées dans vos données – en quelques secondes. Le logiciel vous donne automatiquement des suggestions et identifie les mesures connexes.
Informations intégrées
Intégrez des informations visuelles individuelles provenant des rapports SAS Visual Analytics, créez des scénarios interactifs et intégrez l'ensemble du rapport ou la page interactive dans vos applications web personnalisées. Publiez vos informations à l'échelle avec la flexibilité des données en direct ou des instantanés de données intégrés pour la narration des données.
Applications SAS Visual Analytics pour appareils mobiles
Utilisez des applications mobiles natives pour iOS et Android afin de visualiser et d'interagir avec d'autres utilisateurs par le biais de rapports et de tableaux de bord dynamiques sur des tablettes et des smartphones.
Intégration ouverte pour les développeurs
Ajoutez une visualisation créative avec des bibliothèques JavaScript tierces, telles que D 3 et C3, avec une interactivité totale dans SAS Visual Analytics. Tirez parti des ressources de développement open source pour les développeurs et des API REST pour n’importe quel langage client afin d’accéder aux analyses, données et services SAS.
Architecture cloud native
L’architecture de SAS Viya est rapide, compacte et cloud native. Que vous préfériez utiliser SAS Cloud ou un fournisseur de cloud public ou privé, vous serez en mesure de tirer le meilleur parti de votre investissement dans le cloud.
Intégration avec Microsoft 365
L’intégration transparente entre SAS for Microsoft 365 et SAS Viya vous permet d’intégrer de puissantes informations analytiques de SAS dans vos applications Microsoft 365, suscitant ainsi la collaboration et favorisant des décisions plus éclairées.
Prise en charge linguistique
Les langues prises en charge sont le japonais, le coréen, le chinois simplifié, le chinois traditionnel, le thaï, l’allemand, l’espagnol, le français, l’italien, le polonais, le russe, l’arabe, le tchèque, le danois, l’anglais, le grec, le croate, le hongrois, l’hébreu, le norvégien, le norvégien, le portugais brésilien, le portugais, le slovaque, le slovène, le serbe, le suédois et le turc.
Démos interactives
Consultez ces démonstrations interactives de SAS Visual Analytics pour voir avec quelle rapidité et quelle facilité vous pouvez explorer et comprendre les données afin de résoudre un grand nombre de problèmes industriels et commerciaux.
- PUBLIC HEALTH Emerging Disease Surveillance & ForecastingCreate an automated, insightful and transparent surveillance program for use in detecting new disease activity and tracking seasonal diseases.
- Banque Banking & Risk InsightsObtenez une vision globale des risques et des performances dans toutes les régions, jusqu'au niveau des contreparties individuelles.
- Retail & Biens de consommation Perspectives du commerce de détailAnalyser les performances des magasins régionaux et prendre des décisions fondées sur des données concernant les fonctions commerciales de détail.
- Industrie Analyse de la garantieAnalyser les demandes de garantie afin d'identifier rapidement les problèmes potentiels et leurs causes sous-jacentes.
- Transport & Énergie Consommation d'eau & QualitéContrôler la qualité et la consommation de cette ressource naturelle essentielle.
SAS Viya est une solution cloud-native et cloud-agnostic.
Consommez SAS comme vous l'entendez - SAS managed ou autogéré. Et où vous voulez.
En savoir plus sur SAS Visual Analytics et au-delà
Pour explorer les ressources par type, sélectionnez une option ci-dessous.
-
- Sélectionnez un type de ressource
- ARTICLE
- BLOG POST
- Ebook
- Extrait du livre
- Infographie
- Interview
- Livre blanc
- RAPPORT D'ANALYSTE
- Recherche
- Série
- Témoignage client
- Vidéo
- Webinaire
- ÉTUDE DE CAS
- Témoignage client Integrating data, generative AI and human expertise to tackle global warming The Southern States Energy Board uses SAS Viya to analyze and manage vast amounts of geological, regulatory and community sentiment data with speed and precision.
- Ebook Government navigating an uncertain worldHow governments can harness data, advanced analytics, and trustworthy AI to prepare for the unexpected—and respond faster to protect and improve citizens’ lives.
- Témoignage client Award-winning bank’s data-driven strategy boosts productivity, efficiency and customer centricityAn ‘analytics for all’ approach helps Banca Intesa Beograd foster informed decision making, innovation and sustainable growth.
- Témoignage client AI helps students graduate from collegeHillsborough (FL) Community College uses SAS® Visual Analytics to determine what students need to complete their degrees
- Témoignage client One airport operator is making every journey personal for passengersiGA Istanbul Airport creates personalized customer journeys using SAS® MarTech solutions
- Témoignage client Accompagner les transformations grâce aux outils décisionnels analytiquesMutuelle d’épargne retraite, La France Mutualiste s’est dotée d’une plateforme analytique SAS. Une offre utilisée tout d’abord pour répondre à des besoins réglementaires, avant de s’étendre plus largement au sein des différentes directions du groupe, dont la direction commerciale.
- Témoignage client Accompagner les transformations grâce aux outils décisionnels analytiquesMutuelle d’épargne retraite, La France Mutualiste s’est dotée d’une plateforme analytique SAS. Une offre utilisée tout d’abord pour répondre à des besoins réglementaires, avant de s’étendre plus largement au sein des différentes directions du groupe, dont la direction commerciale.
- Témoignage client Jakarta Smart City uses IoT analytics to better serve residentsJakarta and SAS team up to create an award-winning approach to public services and disaster management.
- Témoignage client Relais Colis s’appuie sur l’analytique pour optimiser ses processus et sa productivité Relais Colis migre vers SAS Viya 4, la plateforme cloud de nouvelle génération capable d’accompagner plus efficacement l’entreprise sur ses nouveaux besoins.
- Témoignage client Managing Dutch roads and waterways with intelligenceA modern AI, IoT and analytics platform powered by SAS Viya helps Rijkswaterstaat move from reactive to predictive infrastructure maintenance.
- Témoignage client Témoignage client Advanced analytics helps policymakers determine how new tax measures would affect citizensAscertaining the ‘winners’ and ‘losers’ of potential tax changes before regulations are implemented.
- Témoignage client Optimizing cancer patient care with advanced analyticsSAS Viya helps create custom care pathways for Oscar Lambret Center cancer patients.
- Témoignage client Automated safety reporting protects hospital patients in NorwayHelse Nord uses SAS to automate its hospitals’ processes and halves their workload.
- Témoignage client Depuis 15 ans, Verspieren modernise et renforce son expertise analytique avec SASComment les solutions analytiques SAS ont su accompagner Verspieren depuis 2008.
- Témoignage client Taking the guesswork out of production planningEuramax uses SAS to prevent production delays
- Témoignage client Hospitals save time and money with real-time medical device tracking Jan Yperman Hospital uses Blyott and SAS Visual Analytics on SAS Viya to monitor hospital asset locations and ensure optimal purchasing decisions.
- Témoignage client Improving data collection and modeling to accelerate predictive medicine effortsDompé farmaceutici uses SAS for predictive analytics and quantitative disease modeling.
- Témoignage client Enhancing road safety with advanced analyticsBelgium’s FPS Justice uses insights from SAS Visual Analytics to crack down on excessive speeding and take more effective action against traffic violators.
- Témoignage client Ensuring public transparency and one-stop access to crime data and analysisThe North Carolina Criminal Justice Analysis Center uses SAS Viya on SAS Cloud to improve data accessibility and efficiencies in gathering and reporting state and county criminal justice statistics to stakeholders, policymakers and citizens.
- ARTICLE Are you good at scoring?Credit scoring is the foundation for evaluating clients who apply for a loan (or other types of exposure for the bank). It is not unusual for it to take up to 12 months to build and deploy a new credit scoring model. Reforming the process will help minimize losses, increase earnings and reduce operational risk.
- Témoignage client One of the largest multi-sport clubs in Portugal aims to win big with analyticsSport Lisboa e Benfica modernizes its operations with SAS Analytics, as it looks to expand internationally.
- Témoignage client Analytics helps major public health system run efficient programs and improve patient careThe Los Angeles County Department of Health Services relies on advanced analytics from SAS to meet federal regulations, ensure financial viability and better serve a diverse population of more than 10 million people.
- Témoignage client It’s all in the research: Using AI to solve issues in health careWith the University of Alberta's new health data management and analysis platform, DARC, it can now increase research capacity and provide high-performance computing and data storage in a secure environment. SAS provided the university software to help make its platform thrive amidst a global pandemic.
- Témoignage client Analytic models spotlight risky loansItaly’s Ministry of Economy and Finance uses advanced analytics on SAS Viya to quickly calculate risk on financial guarantees.
- Témoignage client Italy’s second-largest hospital uses advanced analytics for effective pandemic responseGemelli University Hospital uses SAS solutions to predict admissions of patients in the intensive care units and impacts on the organization, from staffing hospital wards to effectively scheduling and managing COVID-19 vaccine administration.
- Témoignage client Finland’s top retail bank applies AI to improve customer service and credit scoringS-Bank provides better customer service and faster, more accurate loan processing time using SAS Viya on Azure.
- Témoignage client Real-time analytics helps telecom provider adapt to changing customer needs during global pandemic and beyondTelefónica Ecuador accelerates digital transformation, improves campaigns and achieves growth via intelligent decisioning powered by SAS.
- Témoignage client Transforming the consumer banking experience through advanced analyticsCIMB Singapore uses SAS Viya to enhance business operations and keep pace with changing customer needs.
- Témoignage client Delivery company relies on analytics to optimize logistics and swiftly meet changing marketplace dynamicsRelais Colis reinvents itself during global pandemic using SAS Visual Analytics to ensure continuity of business and quality of service.
- Témoignage client Analytics helps ensure fair and balanced pay structures across Sweden’s public sectorTietoEVRY and SAS partner to help Sweden's largest employer organization, Adda, offer a nationally aggregated salary planning tool for municipalities and regions across the country.
- Témoignage client L’analytique au cœur de la gestion de la COVID à l’hôpital Après le premier pic de COVID-19, le CHU de Montpellier a misé sur les outils SAS pour anticiper les vagues suivantes et mieux gérer l’épidémie.
- RAPPORT D'ANALYSTE Gartner positions SAS as a Leader in the Magic Quadrant for Data Science and Machine Learning Platforms, Q1 2021Gartner positions SAS as a Leader in the Magic Quadrant for Data Science and Machine Learning Platforms for the eighth consecutive year.
- Webinaire Getting Started With Geo Analysis in SAS® Visual AnalyticsSeeing is believing. Learn the geo analysis capabilities available in SAS Visual Analytics, available out of the box and through Esri integration.
- Témoignage client Travel and tourism forecasts become more accurate with analyticsDER Touristik builds web-based planning tool with SAS to better predict future demand and quickly react to changes in the market.
- Témoignage client Les villes connectées utilisent l'analytique et l'IoT pour prédire et gérer les inondationsLa ville de Cary, en Caroline du Nord, s'est associée à SAS et Microsoft pour protéger ses citoyens des inondations, sécuriser les bassins hydrologiques et soutenir un développement urbain préservant l'environnement.
- Témoignage client Les villes connectées utilisent l'analytique et l'IoT pour prédire et gérer les inondationsLa ville de Cary, en Caroline du Nord, s'est associée à SAS et Microsoft pour protéger ses citoyens des inondations, sécuriser les bassins hydrologiques et soutenir un développement urbain préservant l'environnement.
- ARTICLE From living on the streets to owning a profitable businessZoe Empowers, a ministry for vulnerable children living in life-threatening poverty in Africa and India, finally found a way to measure and reveal its incredible impact. Using SAS, they developed an "empowerment index" that measures improvements in housing, health, education and more for program participants.
- Témoignage client Funding for groundbreaking childhood cancer research fueled by analyticsThe Kids’ Cancer Project uses SAS to improve fundraising efforts for vital cancer research.
- Témoignage client Le traitement des cancers entre dans une nouvelle ère grâce à l'intelligence artificielleL'Amsterdam UMC utilise les solutions analytiques et d'IA de SAS pour évaluer les tumeurs avec plus de rapidité et de précision.
- Témoignage client A model of institutional research champions the value of analytics for allOklahoma State University uses SAS to create an analytics culture and increase student success.
- Témoignage client Predictive analytics and AI deliver a winning fan experience The Orlando Magic uses mobile app data and machine learning to personalize marketing campaigns and analyze game data.
- Témoignage client Forecasting accuracy brings ‘new energy’ to CameroonEnergy supplier Eneo balances supply and demand to boost efficiency, save millions and improve reliability with SAS Energy Forecasting.
- Témoignage client Artificial intelligence and IoT analytics keep aircraft operational for crucial missionsLockheed Martin revolutionizes aircraft maintenance with the SAS Platform.
- Témoignage client Property experts open analytics to new marketsNVM enhances real estate analytics with SAS Viya open architecture.
- Témoignage client Boosting institutional research with data governance and self-service reportingThe University of Idaho invests in SAS to give administrators access to trusted, insight-rich data.
- Témoignage client Automated laboratories improve uptime with analyticsPredictive service and maintenance keeps Siemens Healthineers lab tests running on time.
- Témoignage client Making faster, better lending decisionsLocal Government Federal Credit Union sees efficiency gains with SAS.
- Témoignage client Le Big Data pour améliorer les transports franciliensSNCF Transilien s’est lancée dans l’aventure de l’analytique, en misant sur la visualisation de données pour embarquer un maximum de collaborateurs.
- Témoignage client Hôpitaux : le big data au coeur de la révolution ambulatoire Avec la data visualisation, l’Assurance Maladie instaure un nouveau dialogue avec les professionnels de santé pour changer les pratiques.
- Témoignage client L'intelligence artificielle de SAS permet d'améliorer la satisfaction clientLes modèles de machine learning pilotés par la plate-forme SAS aident Konica Minolta Japan à réduire ses coûts et à gagner en compétitivité.
- Témoignage client L'intelligence artificielle de SAS permet d'améliorer la satisfaction clientLes modèles de machine learning pilotés par la plate-forme SAS aident Konica Minolta Japan à réduire ses coûts et à gagner en compétitivité.
- Livre blanc Tar Heels Play to Win With SAS Analytics Learn how Carolina Athletics and its fundraising arm, The Rams Club, use SAS Analytics to deepen existing relationships and broaden a longstanding tradition of loyalty to all 28 of their university sports.
- Témoignage client Self-service analytics advances higher educationThe University of Central Florida depends on analytics and data visualization to uncover insights for increased student success.
- Témoignage client Smart data exploration advances K-12 public education programsThe South Carolina Department of Education depends on SAS to analyze data and properly fund and serve its school districts.
- Témoignage client Analytics powers anti-money laundering effortsSAS® aide la banque Landsbankinn à réduire les faux positifs et à optimiser les investigations.
- ARTICLE Location intelligence: Adding geospatial context to BI Get tips for implementing a location intelligence data strategy from industry thought leader and data explorer, Jen Underwood.
- Témoignage client Achieving academic and operational excellence through business intelligenceCurtin University uses SAS Visual Analytics to provide reporting across the organization.
- Livre blanc The Power of CollaborationThis white paper explains the need for and value of the collaboration and self-service capabilities that SAS Visual Analytics and SAS Office Analytics provide. It provides how-to specifics for incorporating SAS Visual Analytics results with Microsoft Outlook, Excel, PowerPoint, Word and SharePoint with plenty of screen shots, explanations and architecture diagrams for IT.
- Interview Location analytics: Why adding where makes BI betterLearn how location analytics can enrich your BI endeavors by blending geographic data, spatial analysis and business data for deeper insights.
- Livre blanc Redefine Your Analytics Journey With Interactive Data Exploration and Predictive AnalyticsWhat if your analytics journey were easier? It can be, in five easy steps. Learn how SAS Visual Analytics and SAS Visual Statistics together can provide a fast, fun way to explore data, build models and find the best performer.
- Livre blanc Data Visualization TechniquesA picture is worth a thousand words – especially when you are trying to find relationships and understand your data – which could include thousands or even millions of variables. This paper takes you from the basics of charts and graphs to visualizing big data using SAS Visual Analytics.
- Ebook Improving Customer ExperienceEveryone makes better decisions with easy access to powerful, interactive analytics – no matter the size of the business. This e-book profiles seven organizations that are using self-service data visualization and exploration to make big improvements in the way they work.
- Livre blanc Workforce AnalyticsThis paper explores how government HR functions can use advanced analytics, machine learning and AI to develop effective plans to meet hiring, retention and performance goals.
- Livre blanc TDWI Checklist Report: Gaining Business Value from Governed Analytics and Discoverydata governance
- Témoignage client University uses analytics to ensure student successWestern Kentucky University uses data visualization and advanced analytics to make informed decisions.
- Témoignage client Better reporting yields better understanding of risk managementSAS Visual Analytics helps Erste Bank Croatia tackle diverse data for accurate analysis.
- Témoignage client Valencia College uses data-driven approach to improve outcomes in higher educationSAS Visual Analytics empowers administrators to easily manage enrollment, and adjust class availability and resources to help students succeed.
- Livre blanc The Use of Open Source is Growing. So Why Do Organizations Still Turn to SAS?This conclusions paper summarizes a session at the 2014 Hadoop Summit presented by Brian Garrett, Principal Solutions Architect at SAS Institute Inc. titled, “With the Rise of Open Source, Why Organizations Still Turn to SAS.” In it, he explains why corporate analytics requirements are best served when companies run both SAS enterprise-class analytics solutions and open source solutions together. Garrett explains how these technologies meet different needs and co-exist well. He also highlights recent SAS software enhancements that allow analysts to incorporate R algorithms into analytic processes as part of a comprehensive, enterprise-class SAS analytics platform.
- ARTICLE Is your data too big to visualize?Use these tips to find new ways to look at big data, so you can quickly collapse and condense the results in an intuitive fashion.
- ARTICLE Why your brain needs data visualizationData visualization software gives you fast answers to your toughest question. In just minutes or seconds. On the fly. Find out how.
- Interview Data visualization: A wise investment in your big data futureData visualization technologies can help the practice of data-driven decision making really take hold. But putting data visualization software in the hands of business users? Is it crazy – or crazy smart?
- Livre blanc Fast and FuriousWhite paper for IT that explains the components and deployment options for SAS Visual Analytics.
- Ebook Augmented Analytics: The secret ingredient to better business intelligenceAugmented analytics breaks down the limitations of business intelligence (BI) and brings forward insights from data using AI and machine learning.
- Livre blanc Building an Analytical Culture for SuccessAn ambitious, culture-centric project reshaped people’s attitudes about data and quickly returned more than a $1 million in cost savings. See the six guiding principles that led to success where three earlier attempts had failed.
Offres associées
Découvrez ces produits et solutions liés à SAS Visual Analytics.
- Logiciel SAS Visual ForecastingSAS Visual Forecasting sur SAS Viya est un système de prévision qui permet de produire rapidement et automatiquement un grand nombre de prévisions fiables.
- SAS® for Microsoft 365Get seamless access to analytical insights by using Microsoft 365 applications alongside SAS Viya.

