Statistical analysis
SAS Visual Statistics
Discover, predict and act – decisively.
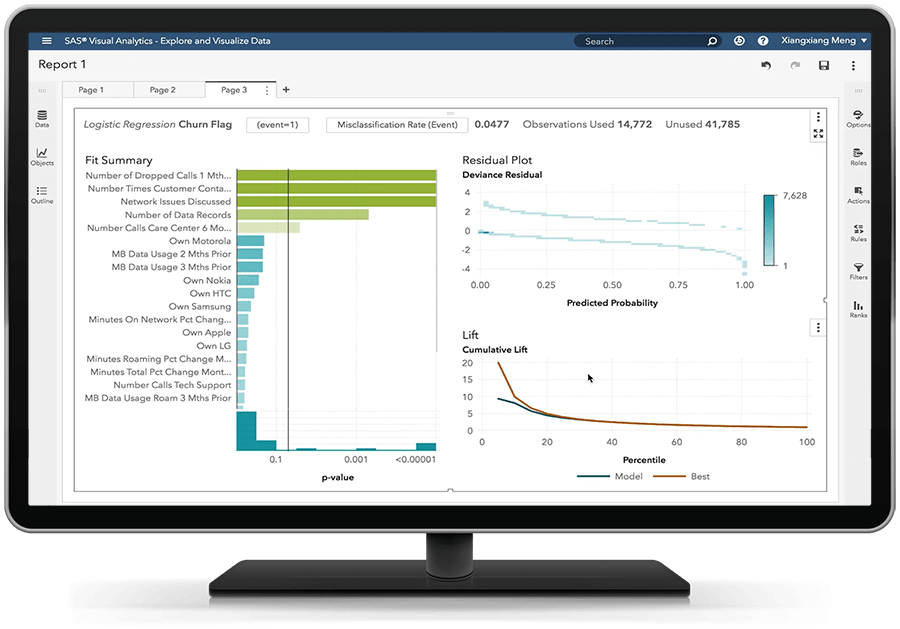
With SAS Visual Statistics, multiple users can explore data, then interactively create and refine predictive models.


Uncover opportunities faster than your competitors.
Your data scientists and statisticians can act on observations at a granular level using the most appropriate analytical modeling techniques. The result? You'll unearth insights at unprecedented speeds, and find new ways to grow revenue.
Put better models into action faster.
Easily build and refine models to target specific groups or segments, and run numerous scenarios simultaneously. You can ask more what-if questions to get better results. And put results into action with automatically generated score code.


Boost analytical productivity.
Empower multiple users to interact with data visually – to add or change variables, remove outliers, etc. Instantly see how changes affect your model's predictive power, and make refinements quickly.
Gain the freedom to experiment.
Data science teams have the ultimate flexibility of working in their language of choice, so they can use their skills to the fullest. SAS Visual Statistics unites all analytical assets – whether created using SAS or other languages like R, Python, Java or Lua – within a common solution.


Key Features
Interactive data exploration and discovery combined with the ability to easily build and adjust huge numbers of predictive models on the fly.
Data access, preparation & quality
Access, profile, cleanse and transform data using an intuitive interface that provides self-service data preparation capabilities with embedded AI.
Custom chatbot creation
Create and deploy custom, natural language chatbots via an intuitive, low-code visual interface for chatbot-enabled insights and conversational user experiences.
Data visualization
Visually explore data, and create and share smart visualizations and interactive reports through a single, self-service interface. Augmented analytics and advanced capabilities accelerate insights and help you uncover stories hidden in your data.
Descriptive & predictive modeling
Explore and evaluate segments visually for further analysis using k-means clustering, scatter plots and detailed summary statistics. Use machine learning techniques to build predictive models from a visual or programming interface.
Open, code-based model development
Programmatically access analytical actions from SAS Studio, call them from other languages – Python, R, Lua, Java – or use public REST APIs to add SAS Analytics to existing applications.
Dynamic group-by processing
Concurrently build models and process results for each group or segment without having to sort or index data each time.
Model comparison, assessment & scoring
Generate model comparison summaries (lift charts, ROC charts, concordance statistics, misclassification tables) on one or more models. Export models as SAS DATA step code, and apply them to new data.
Cloud native
SAS Viya's architecture is compact, cloud native and fast. Whether you prefer to use the SAS Cloud or a public or private cloud provider, you'll be able to make the most of your cloud investment.
SAS Viya est une solution cloud-native et cloud-agnostic.
Consommez SAS comme vous l'entendez - SAS managed ou autogéré. Et où vous voulez.
Explore More on SAS Visual Statistics and Beyond
To browse resources by type, select an option below.
-
- Select Resource Type
- Livre blanc
- Livre blanc
- RAPPORT D'ANALYSTE
- Témoignage client
-
Témoignage client Getting more people behind the wheel with predictive modeling and personalized financing solutionsToyota Financial Services Italia uses SAS Viya to better understand customers, tailor communications and customize financing options for buying or leasing vehicles.
-
Témoignage client Témoignage client Advanced analytics helps policymakers determine how new tax measures would affect citizensAscertaining the ‘winners’ and ‘losers’ of potential tax changes before regulations are implemented.
-
Témoignage client Analytics helps major public health system run efficient programs and improve patient careThe Los Angeles County Department of Health Services relies on advanced analytics from SAS to meet federal regulations, ensure financial viability and better serve a diverse population of more than 10 million people.
-
Témoignage client Transforming the consumer banking experience through advanced analyticsCIMB Singapore uses SAS Viya to enhance business operations and keep pace with changing customer needs.
Related Offerings
Check out these products and solutions related to SAS Visual Statistics.


