Can using Data Discovery aid in the prediction of Earthquakes and Volcanoes?
By Niall Wynne, SAS Ireland
The art and science of prediction for earthquakes and volcanoes has come a long way from the ancient times of celestial harbingers of doom to the modern-day scientific discipline of high powered numerical algorithm number crunching. But we still haven’t laid down a precise method for accurate foresight.
With this in mind we ask, ‘Is there any benefit in utilising the non-standard ways of prediction to increase the accuracy of the modern scientific method?’
Below some very quick and easy data discovery techniques have been used to visualise two datasets (earthquakes and volcanic eruptions from 1900 to 2014[1]) to see if any insights can be found based on non-standard prediction methods.
The Association Method [2]
The association method records an event today, then looks back into history to find a similar event in the past and use that timeline to predict when the next one will occur.

Map 1 showing probability and magnitude of next earthquakes predicted region
The result of this method of prediction is shown on the map above. The scenario here is that a particular region has experienced an earthquake (The Fiji Region) and based on earthquakes following that regions’ past we can map the probability of where the next earthquake might occur. From the map above, based on the colour coding showing probabilities from low (red) to high (blue), if an earthquake occurred in the Fiji region there is a higher probability of the next earthquake happening in the Indonesia, Fiji or South America region[3] respectively.
The reason the scientific community doesn’t adopt this type of method is because it doesn’t take into account the non-linear chaotic dynamics that most natural phenomenon exhibit. This method is similar to stating that if there were two earthquakes in a particular region in the last 100 years then there will be another one in that region in the next 50 years. A commonly heard quote from the scientific community but with little mathematical backing.
Earthquakes of this magnitude are just too rare to be able to have any significance with this method on its own. However, it may be able to point to a particular region, therefore increasing the forecast ability achieved by more commonly used scientific techniques. Following this method we can look back at the most recent earthquake activity to see how it has performed.
For magnitude 6+ earthquakes the following are the most recent and what was predicted following them using the association prediction method:
| EQ Event Location | Magnitude | Date | Region of highest probability for next EQ | Region of 2nd highest probability for next EQ | Region of 3rd highest probability for next EQ |
|---|---|---|---|---|---|
| Vanuatu | 6.8 | 23/01/2015 | Vanuatu 20% | South America Region 8% | Papua New Guinea 7% |
| Figi [4] | 6.2 | 28/01/2015 | Indonesia 11% | Figi 10% | South America 10% |
| Argentina | 6.3 | 02/02/2015 | South America 21% | Indonesia 9% | Japan 6% |
| Argentina | 6.7 | 11/02/2015 | South America 21% | Indonesia 9% | Japan 6% |
Table 1 showing most recent Earthquake activity and where the next earthquake is predicted to occur.
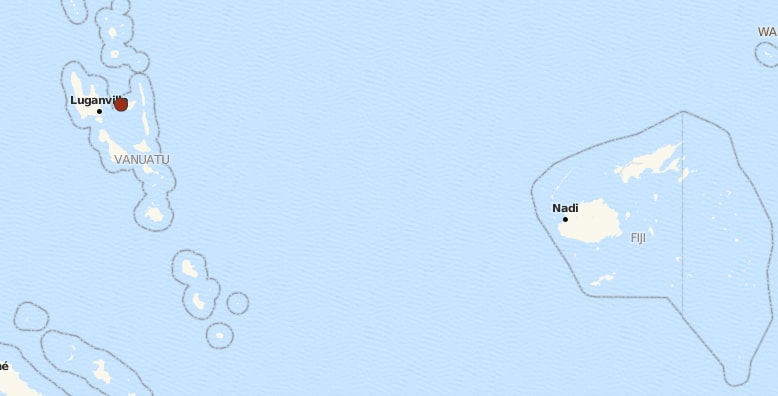
From the table above, based on the association method, when the 6.8 magnitude earthquake hit Vanuatu on Jan 23rd the next earthquake of magnitude 6 or more should have hit the same area. This isn’t too far from what actually happened as the next earthquake was in Fiji which is relatively close to Vanuatu. See map below.

Map 2 showing locations of Vanuatu and Fiji
The earthquake following the Fiji one was predicted to be fairly even between Indonesia, Fiji and South America and South America came up. The Earthquake following the Argentina earthquake was predicted at 21% somewhere else in South American and did in fact happen again in Argentina.
This method, using simple data discovery procedures, is not a definitive guide in itself but could be used as an aid for narrowing down further analysis.
The Earth-Sun Distance Method
One of the more controversial methods of prediction is the connection between the earth and the sun. People will generally brush this off as astrology, spirituality or general non-scientific methodology. But does it have any merit in aiding scientific probability?
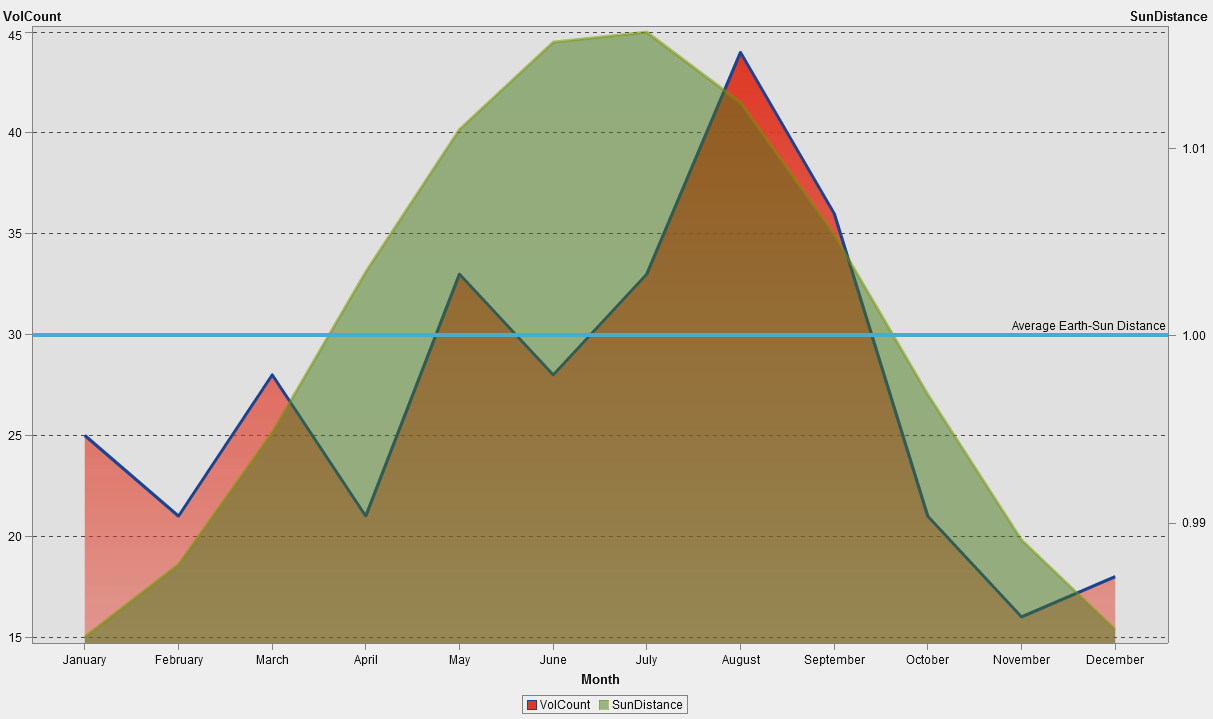
If we look at the chart below we can see the count of volcanoes[5] erupting per month (Red) compared with the earth-sun distance (Green). The chart below seems to suggest that the further the earth is from the sun (April to September: 196 eruptions) the number of volcano eruptions increases. Whereas when the earth is closer to the sun (October to March: 130 eruptions), it decreases.

Chart 1 showing volcano count and average sun-earth distance by month
From the graph it would be easy to assume that there is a correlation between the earth-sun distance and volcanic activity. The rarity of volcanic events however doesn't give us enough evidence to make such assumptions. What would be interesting though would be to look at the measurements collected for highlighting a precursor to a volcanic event, such as gas emissions, ground deformation, volcanic seismic events or other such recordings. You could then see if there are any spikes around the times where the graph above indicates higher volcanic activity has occurred. Data discovery highlights these pointers, which can go on to aid further research.
The ability to throw disparate datasets together using technology like that used above[6] gives the user the insights that might not be available to those using less interactive technologies. It takes seconds to compare these measurements against each other and surprising results can appear.
Overall, non-standard methods such as the above, that have previously been discounted as not rigorous enough or not giving significant results on their own, could lead to an improvement, even by a fraction, of the accepted prediction methods. Until we have a definite algorithm for forecasting natural events the above type of data discovery could be used to try find little nuggets of information to help along the way.
[1] (USGS, 2014)
[2] This is not related to association/market basket analysis type modelling
[3] Only earthquakes of magnitude 6 and above have been used
[4] See Map 1 above
[5] Confirmed eruptions only from 1900 - 2014 (NOAA, n.d.)
[6] SAS Visual Analytics was used for this study
Bibliography
NOAA, n.d. NOAA. [Online]
Available at: http://www.ngdc.noaa.gov/nndc/servlet/ShowDatasets?dataset=102557&search_look=50&display_look=50
[Accessed 11 02 2015].
Tech, M., 2015. 1. [Online]
Available at: http://www.geo.mtu.edu/UPSeis/waves.html
[Accessed 10 02 2015].
USGS, 2014. 1. [Online]
Available at: http://earthquake.usgs.gov/earthquakes/search/
Wikipedia, 2015. 1. [Online]
Available at: http://en.wikipedia.org/wiki/Flashbulb_memory
About SAS
SAS is a global leader in data and AI. With SAS software and industry-specific solutions, organizations transform data into trusted decisions. SAS gives you THE POWER TO KNOW®.