SAS Visual Statistics
Discover, predict and act – decisively – with interactive data exploration and discovery combined with the ability to easily build and adjust huge numbers of predictive models on the fly.
Key features
Data access, preparation, & quality
Access, profile, cleanse, and transform data using an intuitive interface that provides self-service data preparation capabilities with embedded AI.
Custom chatbot creation
Create and deploy custom, natural language chatbots via an intuitive, low-code visual interface for chatbot-enabled insights and conversational user experiences.
Data visualization
Visually explore data, and create and share smart visualizations and interactive reports through a single, self-service interface. Augmented analytics and advanced capabilities accelerate insights and help you uncover stories hidden in your data.
Descriptive & predictive modeling
Explore and evaluate segments visually for further analysis using k-means clustering, scatter plots and detailed summary statistics. Use machine learning techniques to build predictive models from a visual or programming interface.
Open, code-based model development
Programmatically access analytical actions from SAS Studio, call them from other languages – Python, R, Lua, Java – or use public REST APIs to add SAS Analytics to existing applications.
Dynamic group-by processing
Concurrently build models and process results for each group or segment without having to sort or index data each time.
Model comparison, assessment & scoring
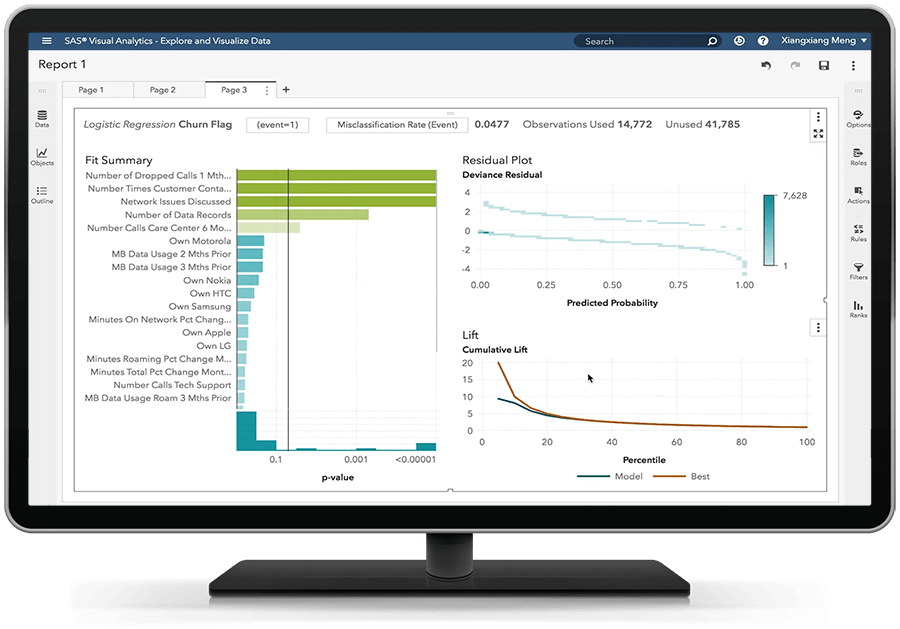
Generate model comparison summaries (lift charts, ROC charts, concordance statistics, misclassification tables) on one or more models. Export models as SAS DATA step code, and apply them to new data.
Cloud native
SAS Viya's architecture is compact, cloud native and fast, enabling you to make the most of your cloud investment regardless of your cloud provider.
Get to know SAS Visual Statistics
Training resources for SAS Visual Statistics
SAS Viya is cloud-native and cloud-agnostic
Consume SAS how you want – SAS managed or self-managed. And where you want.
Recommended resources for SAS Visual Statistics
To browse resources by type, select an option below.
-
- Select resource type
- Customer Story
- Customer Story
- White Paper
-
Customer Story Getting more people behind the wheel with predictive modeling and personalized financing solutions
-
Customer Story Predictive analytics and AI deliver a winning fan experience
-
Customer Story Finland’s top retail bank applies AI to improve customer service and credit scoring
-
Customer Story Zeroing in on property values with machine learning


