SAS Visual Analytics
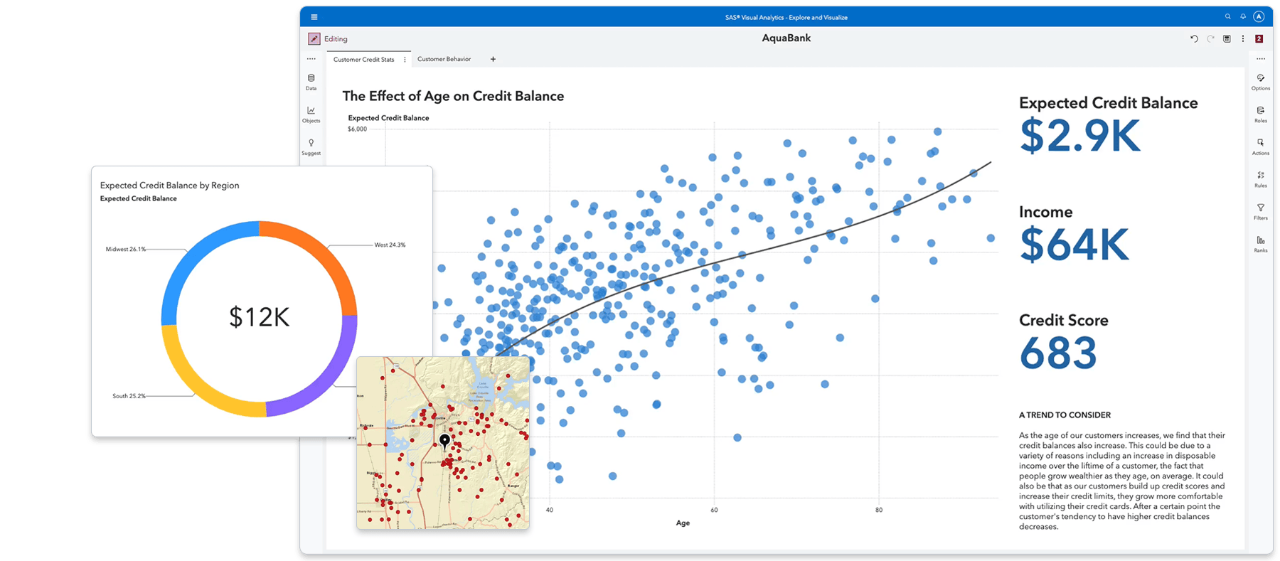
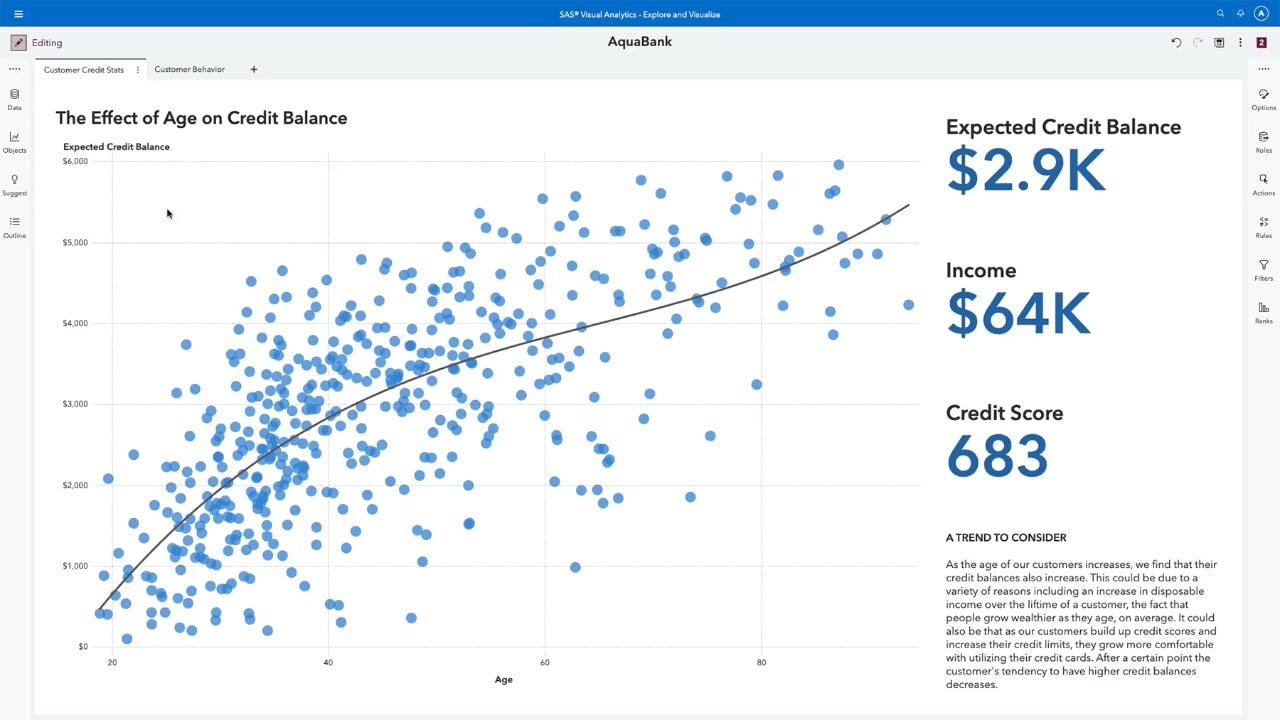
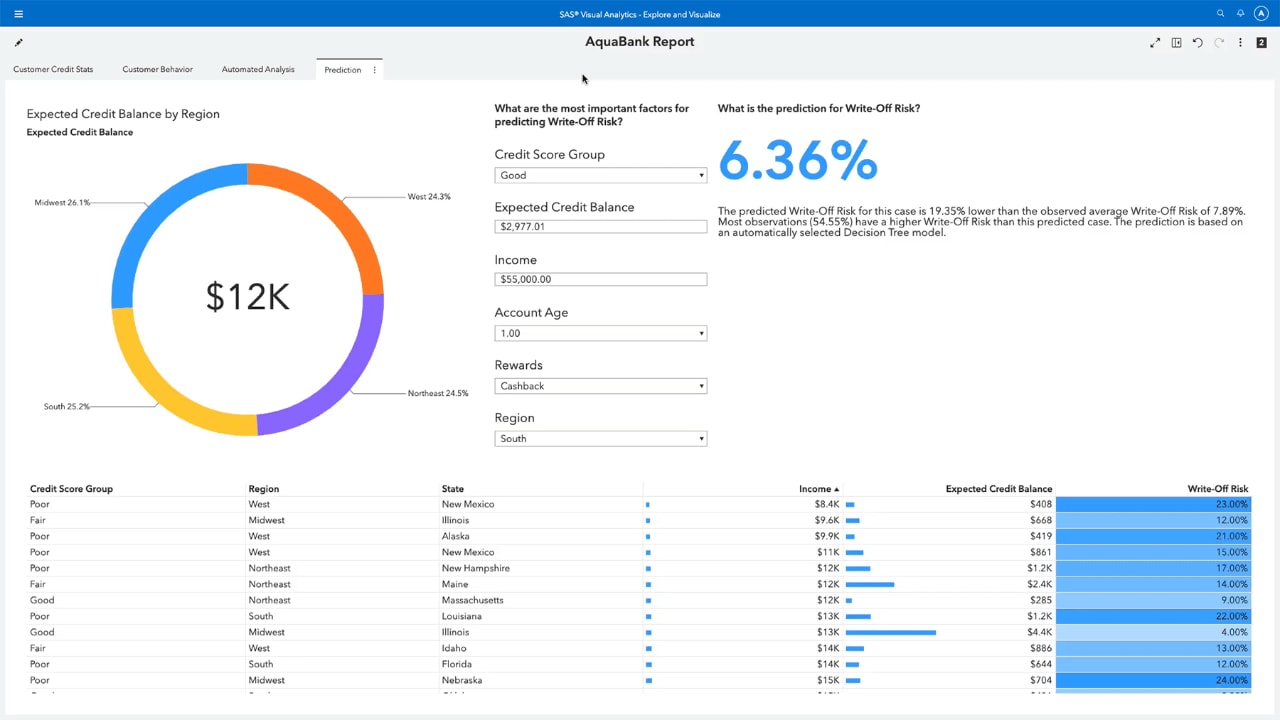
Now everyone can easily discover and share powerful insights that inspire action with a single application for reporting, data exploration and analytics.

Key Features
Interactive reporting. Visual discovery. Self-service analytics. Scalability and governance. All from a single, powerful in-memory environment.
Embedded insights
Embed individual visual insights from SAS Visual Analytics reports, build interactive stories or embed the whole interactive report or page into your custom web applications. Publish your insights that scale with the flexibility of live data or embedded data snapshots for data storytelling.
SAS Visual Analytics Apps for mobile devices
Use native mobile apps for iOS and Android to view and interact with others through dynamic reports and dashboards on tablets and smartphones.
Open integration for developers
Add creative visualization with third-party JavaScript libraries, such as D3 and C3, with full interactivity within SAS Visual Analytics. Leverage open source development resources for developers and REST APIs for any client language to access SAS analytics, data and services.
Интерактивные демо
Ознакомьтесь с этими интерактивными демонстрационными примерами SAS Visual Analytics, чтобы узнать, как быстро и просто вы можете исследовать и понимать данные для решения различных отраслевых и бизнес-задач.
-
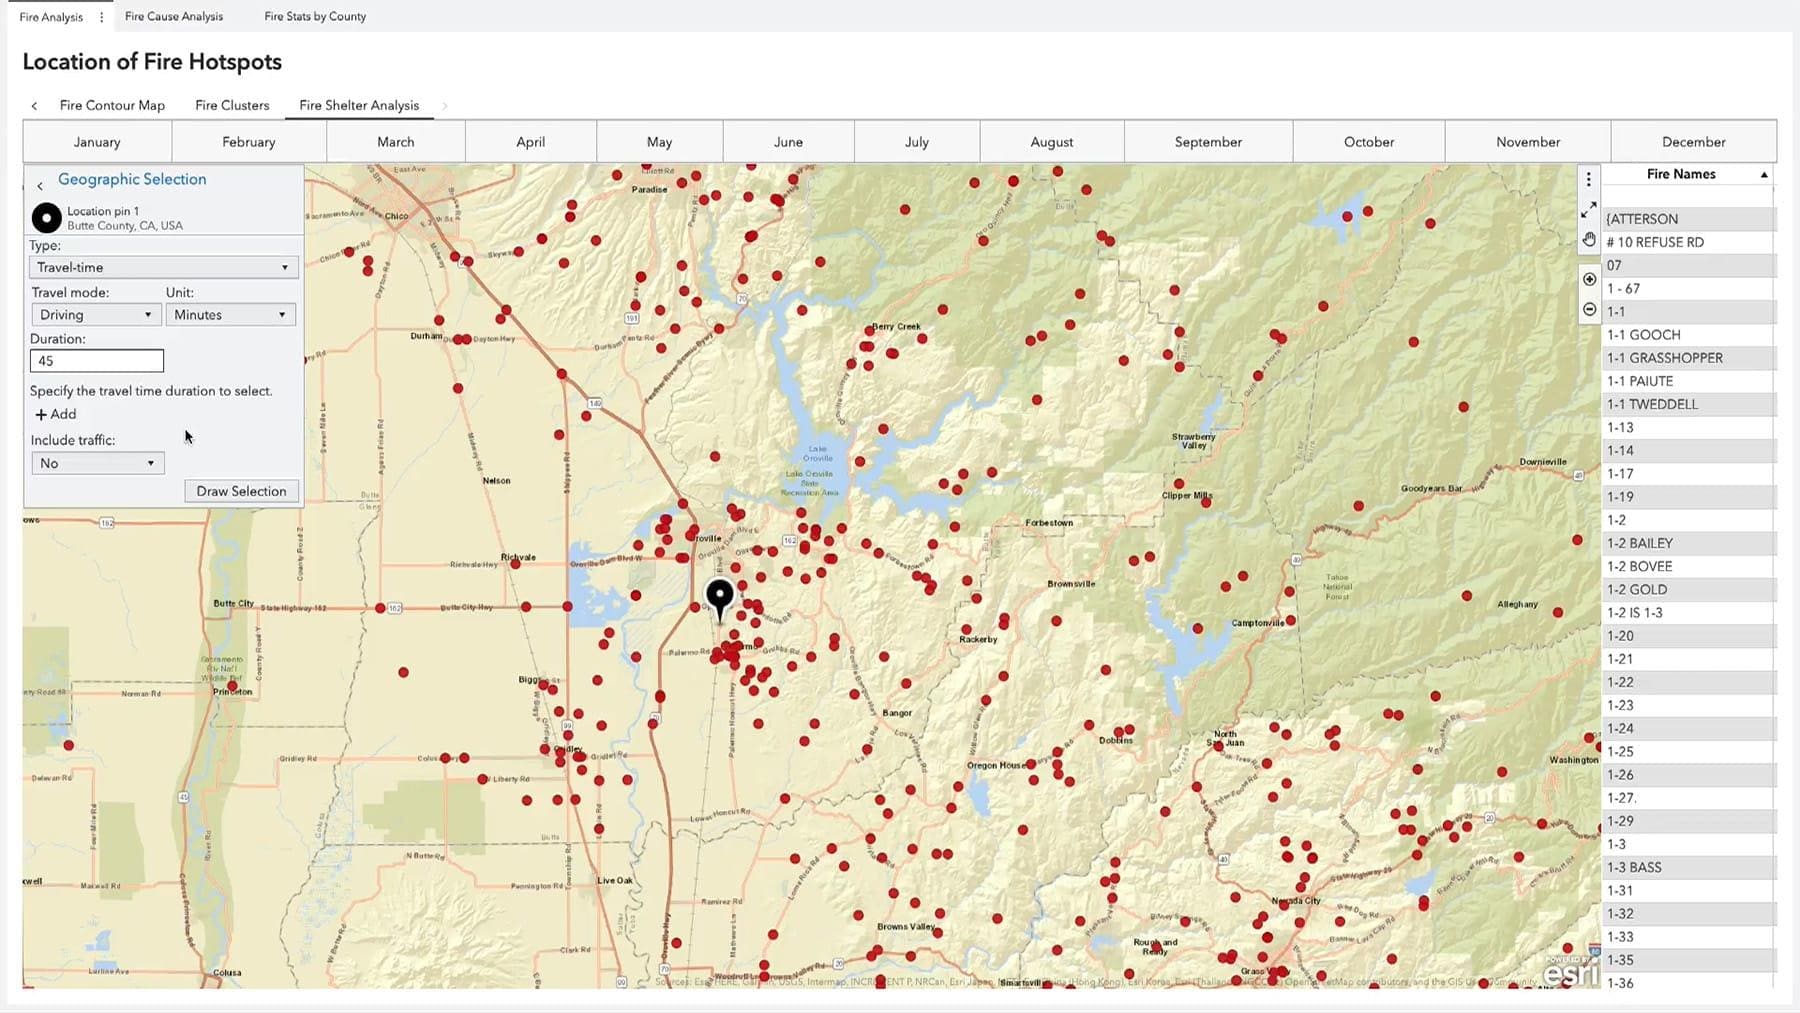
PUBLIC HEALTH Emerging Disease Surveillance & ForecastingCreate an automated, insightful and transparent surveillance program for use in detecting new disease activity and tracking seasonal diseases.
-
UTILITIES Water Consumption & QualityMonitor the quality and consumption of this critical natural resource.
-
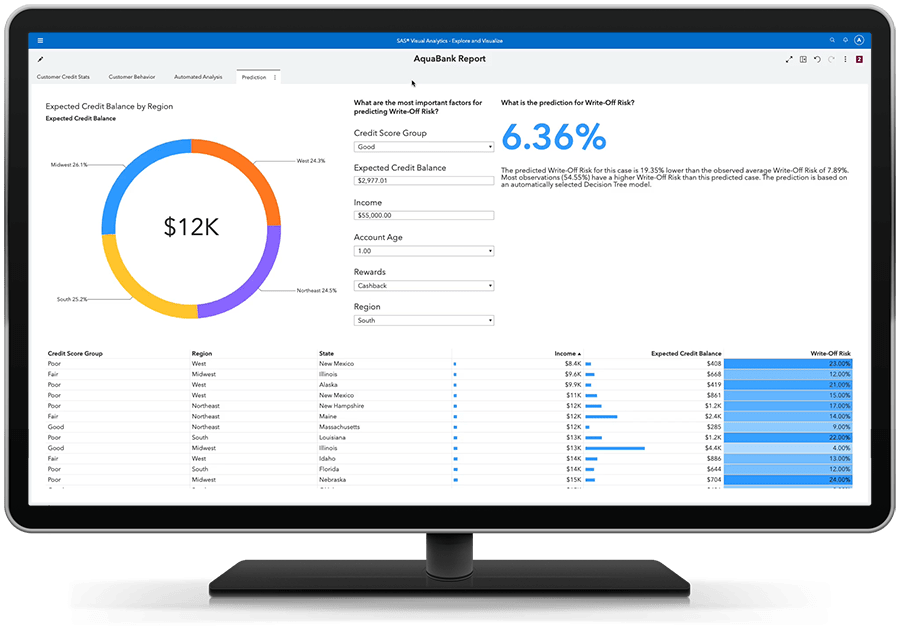
BANKING Banking & Risk InsightsGet a holistic view of risk and performance across regions, down to the individual counterparty level.
-
RETAIL & CONSUMER GOODS Retail InsightsAnalyze regional store performance, and make data-driven decisions about retail business functions.
-
MANUFACTURING Warranty AnalysisAnalyze warranty claims to quickly identify potential issues and their underlying causes.

SAS Viya is cloud-native and cloud-agnostic
Consume SAS how you want – SAS managed or self-managed. And where you want.

Узнайте больше о SAS ® Visual Analytics и не только
Для просмотра ресурсов по типу выберите один из вариантов ниже.
-
- Выберите тип ресурса
- Технический документ
- Технический документ
- Вебинар
- Customer Story
- E-Book
- Interview
-
Customer Story Поиск лучших клиентов с помощью аналитикиSeacoast Bank enhances customer value using AI and SAS Visual Analytics on SAS Viya.
-
Customer Story Как обеспечить безопасность пациентов с психическими расстройствами во время пандемии?SAS delivers dashboard to monitor COVID-19 in the Copenhagen Regional Psychiatric Centers.
-
Технический документ Redefine Your Analytics Journey With Interactive Data Exploration and Predictive AnalyticsWhat if your analytics journey were easier? It can be, in five easy steps. Learn how SAS Visual Analytics and SAS Visual Statistics together can provide a fast, fun way to explore data, build models and find the best performer.
-
Технический документ The Use of Open Source is Growing. So Why Do Organizations Still Turn to SAS?This conclusions paper summarizes a session at the 2014 Hadoop Summit presented by Brian Garrett, Principal Solutions Architect at SAS Institute Inc. titled, “With the Rise of Open Source, Why Organizations Still Turn to SAS.” In it, he explains why corporate analytics requirements are best served when companies run both SAS enterprise-class analytics solutions and open source solutions together. Garrett explains how these technologies meet different needs and co-exist well. He also highlights recent SAS software enhancements that allow analysts to incorporate R algorithms into analytic processes as part of a comprehensive, enterprise-class SAS analytics platform.
-
Customer Story Using artificial intelligence to decode dance patterns of beesAmesto NextBridge and Beefutures use visual analytics and machine learning to help protect and support healthy bee populations.
-
Interview Data visualization: A wise investment in your big data futureData visualization technologies can help the practice of data-driven decision making really take hold. But putting data visualization software in the hands of business users? Is it crazy – or crazy smart?
-
Customer Story «Первое кредитное бюро» предложило новую услугу на базе инструментов аналитики SAS и облачной платформы StatCloudОблачная интерактивная среда, построенная на решениях компании SAS, позволяет клиентам Бюро анализировать свой портфель и видеть свои позиции относительно остального финансового рынка.
-
E-Book Government navigating an uncertain worldHow governments can harness data, advanced analytics, and trustworthy AI to prepare for the unexpected—and respond faster to protect and improve citizens’ lives.

Сопутствующие продукты
Ознакомьтесь с продуктами, связанными с SAS Visual Analytics, построенными на SAS Platform.
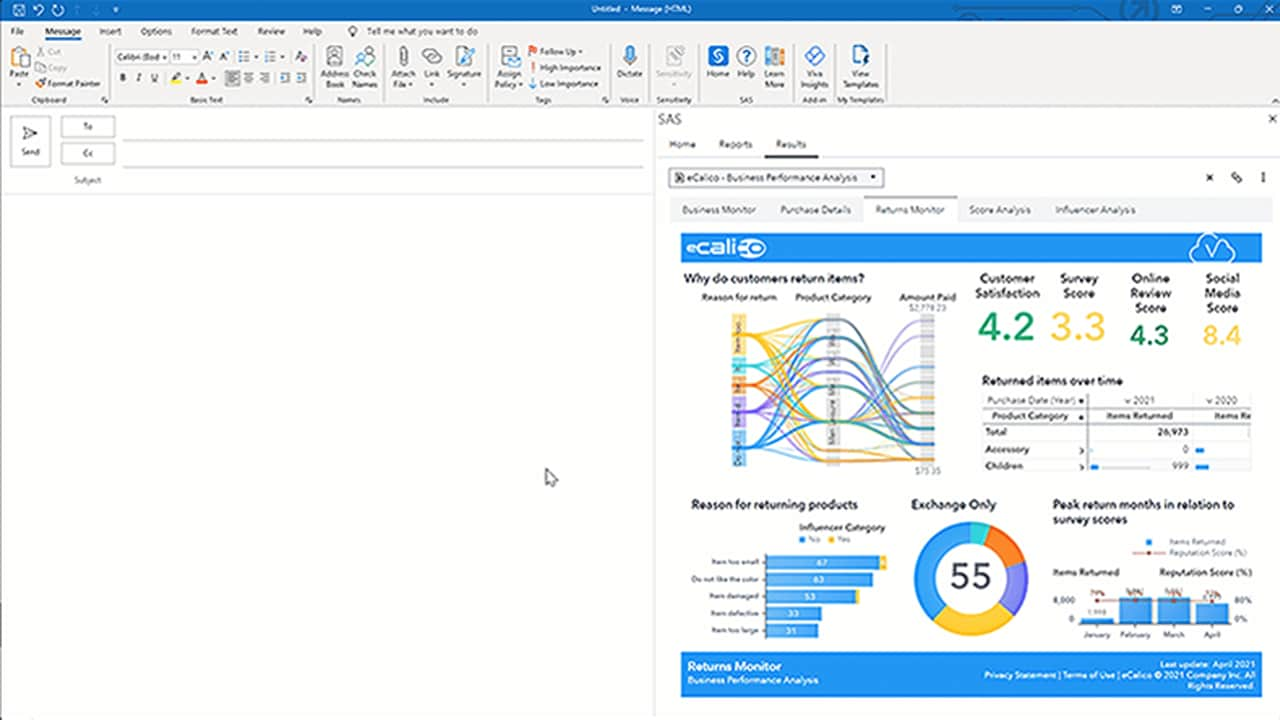
- SAS® for Microsoft 365Get seamless access to analytical insights by using Microsoft 365 applications alongside SAS Viya.
- SAS® Visual ForecastingРешайте стоящие перед компанией задачи планирования с помощью системы, которая автоматически составляет масштабные иерархические прогнозы, поддерживает SAS и открытые языки программирования в рамках одной среды.
- SAS® Visual InvestigatorРешайте самые разные задачи интеллектуального анализа и управления исследованиями с помощью технологий углубленного анализа и машинного обучения в единой облачной аналитической среде.
- SAS® Visual StatisticsВ этой системе множество пользователей могут исследовать данные, а затем создавать и уточнять описательные и прогнозные модели в интерактивном режиме.
